Goertzel Browser [Loxx]As the financial markets become increasingly complex and data-driven, traders and analysts must leverage powerful tools to gain insights and make informed decisions. One such tool is the Goertzel Browser indicator, a sophisticated technical analysis indicator that helps identify cyclical patterns in financial data. This powerful tool is capable of detecting cyclical patterns in financial data, helping traders to make better predictions and optimize their trading strategies. With its unique combination of mathematical algorithms and advanced charting capabilities, this indicator has the potential to revolutionize the way we approach financial modeling and trading.
█ Brief Overview of the Goertzel Browser
The Goertzel Browser is a sophisticated technical analysis tool that utilizes the Goertzel algorithm to analyze and visualize cyclical components within a financial time series. By identifying these cycles and their characteristics, the indicator aims to provide valuable insights into the market's underlying price movements, which could potentially be used for making informed trading decisions.
The primary purpose of this indicator is to:
1. Detect and analyze the dominant cycles present in the price data.
2. Reconstruct and visualize the composite wave based on the detected cycles.
3. Project the composite wave into the future, providing a potential roadmap for upcoming price movements.
To achieve this, the indicator performs several tasks:
1. Detrending the price data: The indicator preprocesses the price data using various detrending techniques, such as Hodrick-Prescott filters, zero-lag moving averages, and linear regression, to remove the underlying trend and focus on the cyclical components.
2. Applying the Goertzel algorithm: The indicator applies the Goertzel algorithm to the detrended price data, identifying the dominant cycles and their characteristics, such as amplitude, phase, and cycle strength.
3. Constructing the composite wave: The indicator reconstructs the composite wave by combining the detected cycles, either by using a user-defined list of cycles or by selecting the top N cycles based on their amplitude or cycle strength.
4. Visualizing the composite wave: The indicator plots the composite wave, using solid lines for the past and dotted lines for the future projections. The color of the lines indicates whether the wave is increasing or decreasing.
5. Displaying cycle information: The indicator provides a table that displays detailed information about the detected cycles, including their rank, period, Bartel's test results, amplitude, and phase.
This indicator is a powerful tool that employs the Goertzel algorithm to analyze and visualize the cyclical components within a financial time series. By providing insights into the underlying price movements and their potential future trajectory, the indicator aims to assist traders in making more informed decisions.
█ What is the Goertzel Algorithm?
The Goertzel algorithm, named after Gerald Goertzel, is a digital signal processing technique that is used to efficiently compute individual terms of the Discrete Fourier Transform (DFT). It was first introduced in 1958, and since then, it has found various applications in the fields of engineering, mathematics, and physics.
The Goertzel algorithm is primarily used to detect specific frequency components within a digital signal, making it particularly useful in applications where only a few frequency components are of interest. The algorithm is computationally efficient, as it requires fewer calculations than the Fast Fourier Transform (FFT) when detecting a small number of frequency components. This efficiency makes the Goertzel algorithm a popular choice in applications such as:
1. Telecommunications: The Goertzel algorithm is used for decoding Dual-Tone Multi-Frequency (DTMF) signals, which are the tones generated when pressing buttons on a telephone keypad. By identifying specific frequency components, the algorithm can accurately determine which button has been pressed.
2. Audio processing: The algorithm can be used to detect specific pitches or harmonics in an audio signal, making it useful in applications like pitch detection and tuning musical instruments.
3. Vibration analysis: In the field of mechanical engineering, the Goertzel algorithm can be applied to analyze vibrations in rotating machinery, helping to identify faulty components or signs of wear.
4. Power system analysis: The algorithm can be used to measure harmonic content in power systems, allowing engineers to assess power quality and detect potential issues.
The Goertzel algorithm is used in these applications because it offers several advantages over other methods, such as the FFT:
1. Computational efficiency: The Goertzel algorithm requires fewer calculations when detecting a small number of frequency components, making it more computationally efficient than the FFT in these cases.
2. Real-time analysis: The algorithm can be implemented in a streaming fashion, allowing for real-time analysis of signals, which is crucial in applications like telecommunications and audio processing.
3. Memory efficiency: The Goertzel algorithm requires less memory than the FFT, as it only computes the frequency components of interest.
4. Precision: The algorithm is less susceptible to numerical errors compared to the FFT, ensuring more accurate results in applications where precision is essential.
The Goertzel algorithm is an efficient digital signal processing technique that is primarily used to detect specific frequency components within a signal. Its computational efficiency, real-time capabilities, and precision make it an attractive choice for various applications, including telecommunications, audio processing, vibration analysis, and power system analysis. The algorithm has been widely adopted since its introduction in 1958 and continues to be an essential tool in the fields of engineering, mathematics, and physics.
█ Goertzel Algorithm in Quantitative Finance: In-Depth Analysis and Applications
The Goertzel algorithm, initially designed for signal processing in telecommunications, has gained significant traction in the financial industry due to its efficient frequency detection capabilities. In quantitative finance, the Goertzel algorithm has been utilized for uncovering hidden market cycles, developing data-driven trading strategies, and optimizing risk management. This section delves deeper into the applications of the Goertzel algorithm in finance, particularly within the context of quantitative trading and analysis.
Unveiling Hidden Market Cycles:
Market cycles are prevalent in financial markets and arise from various factors, such as economic conditions, investor psychology, and market participant behavior. The Goertzel algorithm's ability to detect and isolate specific frequencies in price data helps trader analysts identify hidden market cycles that may otherwise go unnoticed. By examining the amplitude, phase, and periodicity of each cycle, traders can better understand the underlying market structure and dynamics, enabling them to develop more informed and effective trading strategies.
Developing Quantitative Trading Strategies:
The Goertzel algorithm's versatility allows traders to incorporate its insights into a wide range of trading strategies. By identifying the dominant market cycles in a financial instrument's price data, traders can create data-driven strategies that capitalize on the cyclical nature of markets.
For instance, a trader may develop a mean-reversion strategy that takes advantage of the identified cycles. By establishing positions when the price deviates from the predicted cycle, the trader can profit from the subsequent reversion to the cycle's mean. Similarly, a momentum-based strategy could be designed to exploit the persistence of a dominant cycle by entering positions that align with the cycle's direction.
Enhancing Risk Management:
The Goertzel algorithm plays a vital role in risk management for quantitative strategies. By analyzing the cyclical components of a financial instrument's price data, traders can gain insights into the potential risks associated with their trading strategies.
By monitoring the amplitude and phase of dominant cycles, a trader can detect changes in market dynamics that may pose risks to their positions. For example, a sudden increase in amplitude may indicate heightened volatility, prompting the trader to adjust position sizing or employ hedging techniques to protect their portfolio. Additionally, changes in phase alignment could signal a potential shift in market sentiment, necessitating adjustments to the trading strategy.
Expanding Quantitative Toolkits:
Traders can augment the Goertzel algorithm's insights by combining it with other quantitative techniques, creating a more comprehensive and sophisticated analysis framework. For example, machine learning algorithms, such as neural networks or support vector machines, could be trained on features extracted from the Goertzel algorithm to predict future price movements more accurately.
Furthermore, the Goertzel algorithm can be integrated with other technical analysis tools, such as moving averages or oscillators, to enhance their effectiveness. By applying these tools to the identified cycles, traders can generate more robust and reliable trading signals.
The Goertzel algorithm offers invaluable benefits to quantitative finance practitioners by uncovering hidden market cycles, aiding in the development of data-driven trading strategies, and improving risk management. By leveraging the insights provided by the Goertzel algorithm and integrating it with other quantitative techniques, traders can gain a deeper understanding of market dynamics and devise more effective trading strategies.
█ Indicator Inputs
src: This is the source data for the analysis, typically the closing price of the financial instrument.
detrendornot: This input determines the method used for detrending the source data. Detrending is the process of removing the underlying trend from the data to focus on the cyclical components.
The available options are:
hpsmthdt: Detrend using Hodrick-Prescott filter centered moving average.
zlagsmthdt: Detrend using zero-lag moving average centered moving average.
logZlagRegression: Detrend using logarithmic zero-lag linear regression.
hpsmth: Detrend using Hodrick-Prescott filter.
zlagsmth: Detrend using zero-lag moving average.
DT_HPper1 and DT_HPper2: These inputs define the period range for the Hodrick-Prescott filter centered moving average when detrendornot is set to hpsmthdt.
DT_ZLper1 and DT_ZLper2: These inputs define the period range for the zero-lag moving average centered moving average when detrendornot is set to zlagsmthdt.
DT_RegZLsmoothPer: This input defines the period for the zero-lag moving average used in logarithmic zero-lag linear regression when detrendornot is set to logZlagRegression.
HPsmoothPer: This input defines the period for the Hodrick-Prescott filter when detrendornot is set to hpsmth.
ZLMAsmoothPer: This input defines the period for the zero-lag moving average when detrendornot is set to zlagsmth.
MaxPer: This input sets the maximum period for the Goertzel algorithm to search for cycles.
squaredAmp: This boolean input determines whether the amplitude should be squared in the Goertzel algorithm.
useAddition: This boolean input determines whether the Goertzel algorithm should use addition for combining the cycles.
useCosine: This boolean input determines whether the Goertzel algorithm should use cosine waves instead of sine waves.
UseCycleStrength: This boolean input determines whether the Goertzel algorithm should compute the cycle strength, which is a normalized measure of the cycle's amplitude.
WindowSizePast and WindowSizeFuture: These inputs define the window size for past and future projections of the composite wave.
FilterBartels: This boolean input determines whether Bartel's test should be applied to filter out non-significant cycles.
BartNoCycles: This input sets the number of cycles to be used in Bartel's test.
BartSmoothPer: This input sets the period for the moving average used in Bartel's test.
BartSigLimit: This input sets the significance limit for Bartel's test, below which cycles are considered insignificant.
SortBartels: This boolean input determines whether the cycles should be sorted by their Bartel's test results.
UseCycleList: This boolean input determines whether a user-defined list of cycles should be used for constructing the composite wave. If set to false, the top N cycles will be used.
Cycle1, Cycle2, Cycle3, Cycle4, and Cycle5: These inputs define the user-defined list of cycles when 'UseCycleList' is set to true. If using a user-defined list, each of these inputs represents the period of a specific cycle to include in the composite wave.
StartAtCycle: This input determines the starting index for selecting the top N cycles when UseCycleList is set to false. This allows you to skip a certain number of cycles from the top before selecting the desired number of cycles.
UseTopCycles: This input sets the number of top cycles to use for constructing the composite wave when UseCycleList is set to false. The cycles are ranked based on their amplitudes or cycle strengths, depending on the UseCycleStrength input.
SubtractNoise: This boolean input determines whether to subtract the noise (remaining cycles) from the composite wave. If set to true, the composite wave will only include the top N cycles specified by UseTopCycles.
█ Exploring Auxiliary Functions
The following functions demonstrate advanced techniques for analyzing financial markets, including zero-lag moving averages, Bartels probability, detrending, and Hodrick-Prescott filtering. This section examines each function in detail, explaining their purpose, methodology, and applications in finance. We will examine how each function contributes to the overall performance and effectiveness of the indicator and how they work together to create a powerful analytical tool.
Zero-Lag Moving Average:
The zero-lag moving average function is designed to minimize the lag typically associated with moving averages. This is achieved through a two-step weighted linear regression process that emphasizes more recent data points. The function calculates a linearly weighted moving average (LWMA) on the input data and then applies another LWMA on the result. By doing this, the function creates a moving average that closely follows the price action, reducing the lag and improving the responsiveness of the indicator.
The zero-lag moving average function is used in the indicator to provide a responsive, low-lag smoothing of the input data. This function helps reduce the noise and fluctuations in the data, making it easier to identify and analyze underlying trends and patterns. By minimizing the lag associated with traditional moving averages, this function allows the indicator to react more quickly to changes in market conditions, providing timely signals and improving the overall effectiveness of the indicator.
Bartels Probability:
The Bartels probability function calculates the probability of a given cycle being significant in a time series. It uses a mathematical test called the Bartels test to assess the significance of cycles detected in the data. The function calculates coefficients for each detected cycle and computes an average amplitude and an expected amplitude. By comparing these values, the Bartels probability is derived, indicating the likelihood of a cycle's significance. This information can help in identifying and analyzing dominant cycles in financial markets.
The Bartels probability function is incorporated into the indicator to assess the significance of detected cycles in the input data. By calculating the Bartels probability for each cycle, the indicator can prioritize the most significant cycles and focus on the market dynamics that are most relevant to the current trading environment. This function enhances the indicator's ability to identify dominant market cycles, improving its predictive power and aiding in the development of effective trading strategies.
Detrend Logarithmic Zero-Lag Regression:
The detrend logarithmic zero-lag regression function is used for detrending data while minimizing lag. It combines a zero-lag moving average with a linear regression detrending method. The function first calculates the zero-lag moving average of the logarithm of input data and then applies a linear regression to remove the trend. By detrending the data, the function isolates the cyclical components, making it easier to analyze and interpret the underlying market dynamics.
The detrend logarithmic zero-lag regression function is used in the indicator to isolate the cyclical components of the input data. By detrending the data, the function enables the indicator to focus on the cyclical movements in the market, making it easier to analyze and interpret market dynamics. This function is essential for identifying cyclical patterns and understanding the interactions between different market cycles, which can inform trading decisions and enhance overall market understanding.
Bartels Cycle Significance Test:
The Bartels cycle significance test is a function that combines the Bartels probability function and the detrend logarithmic zero-lag regression function to assess the significance of detected cycles. The function calculates the Bartels probability for each cycle and stores the results in an array. By analyzing the probability values, traders and analysts can identify the most significant cycles in the data, which can be used to develop trading strategies and improve market understanding.
The Bartels cycle significance test function is integrated into the indicator to provide a comprehensive analysis of the significance of detected cycles. By combining the Bartels probability function and the detrend logarithmic zero-lag regression function, this test evaluates the significance of each cycle and stores the results in an array. The indicator can then use this information to prioritize the most significant cycles and focus on the most relevant market dynamics. This function enhances the indicator's ability to identify and analyze dominant market cycles, providing valuable insights for trading and market analysis.
Hodrick-Prescott Filter:
The Hodrick-Prescott filter is a popular technique used to separate the trend and cyclical components of a time series. The function applies a smoothing parameter to the input data and calculates a smoothed series using a two-sided filter. This smoothed series represents the trend component, which can be subtracted from the original data to obtain the cyclical component. The Hodrick-Prescott filter is commonly used in economics and finance to analyze economic data and financial market trends.
The Hodrick-Prescott filter is incorporated into the indicator to separate the trend and cyclical components of the input data. By applying the filter to the data, the indicator can isolate the trend component, which can be used to analyze long-term market trends and inform trading decisions. Additionally, the cyclical component can be used to identify shorter-term market dynamics and provide insights into potential trading opportunities. The inclusion of the Hodrick-Prescott filter adds another layer of analysis to the indicator, making it more versatile and comprehensive.
Detrending Options: Detrend Centered Moving Average:
The detrend centered moving average function provides different detrending methods, including the Hodrick-Prescott filter and the zero-lag moving average, based on the selected detrending method. The function calculates two sets of smoothed values using the chosen method and subtracts one set from the other to obtain a detrended series. By offering multiple detrending options, this function allows traders and analysts to select the most appropriate method for their specific needs and preferences.
The detrend centered moving average function is integrated into the indicator to provide users with multiple detrending options, including the Hodrick-Prescott filter and the zero-lag moving average. By offering multiple detrending methods, the indicator allows users to customize the analysis to their specific needs and preferences, enhancing the indicator's overall utility and adaptability. This function ensures that the indicator can cater to a wide range of trading styles and objectives, making it a valuable tool for a diverse group of market participants.
The auxiliary functions functions discussed in this section demonstrate the power and versatility of mathematical techniques in analyzing financial markets. By understanding and implementing these functions, traders and analysts can gain valuable insights into market dynamics, improve their trading strategies, and make more informed decisions. The combination of zero-lag moving averages, Bartels probability, detrending methods, and the Hodrick-Prescott filter provides a comprehensive toolkit for analyzing and interpreting financial data. The integration of advanced functions in a financial indicator creates a powerful and versatile analytical tool that can provide valuable insights into financial markets. By combining the zero-lag moving average,
█ In-Depth Analysis of the Goertzel Browser Code
The Goertzel Browser code is an implementation of the Goertzel Algorithm, an efficient technique to perform spectral analysis on a signal. The code is designed to detect and analyze dominant cycles within a given financial market data set. This section will provide an extremely detailed explanation of the code, its structure, functions, and intended purpose.
Function signature and input parameters:
The Goertzel Browser function accepts numerous input parameters for customization, including source data (src), the current bar (forBar), sample size (samplesize), period (per), squared amplitude flag (squaredAmp), addition flag (useAddition), cosine flag (useCosine), cycle strength flag (UseCycleStrength), past and future window sizes (WindowSizePast, WindowSizeFuture), Bartels filter flag (FilterBartels), Bartels-related parameters (BartNoCycles, BartSmoothPer, BartSigLimit), sorting flag (SortBartels), and output buffers (goeWorkPast, goeWorkFuture, cyclebuffer, amplitudebuffer, phasebuffer, cycleBartelsBuffer).
Initializing variables and arrays:
The code initializes several float arrays (goeWork1, goeWork2, goeWork3, goeWork4) with the same length as twice the period (2 * per). These arrays store intermediate results during the execution of the algorithm.
Preprocessing input data:
The input data (src) undergoes preprocessing to remove linear trends. This step enhances the algorithm's ability to focus on cyclical components in the data. The linear trend is calculated by finding the slope between the first and last values of the input data within the sample.
Iterative calculation of Goertzel coefficients:
The core of the Goertzel Browser algorithm lies in the iterative calculation of Goertzel coefficients for each frequency bin. These coefficients represent the spectral content of the input data at different frequencies. The code iterates through the range of frequencies, calculating the Goertzel coefficients using a nested loop structure.
Cycle strength computation:
The code calculates the cycle strength based on the Goertzel coefficients. This is an optional step, controlled by the UseCycleStrength flag. The cycle strength provides information on the relative influence of each cycle on the data per bar, considering both amplitude and cycle length. The algorithm computes the cycle strength either by squaring the amplitude (controlled by squaredAmp flag) or using the actual amplitude values.
Phase calculation:
The Goertzel Browser code computes the phase of each cycle, which represents the position of the cycle within the input data. The phase is calculated using the arctangent function (math.atan) based on the ratio of the imaginary and real components of the Goertzel coefficients.
Peak detection and cycle extraction:
The algorithm performs peak detection on the computed amplitudes or cycle strengths to identify dominant cycles. It stores the detected cycles in the cyclebuffer array, along with their corresponding amplitudes and phases in the amplitudebuffer and phasebuffer arrays, respectively.
Sorting cycles by amplitude or cycle strength:
The code sorts the detected cycles based on their amplitude or cycle strength in descending order. This allows the algorithm to prioritize cycles with the most significant impact on the input data.
Bartels cycle significance test:
If the FilterBartels flag is set, the code performs a Bartels cycle significance test on the detected cycles. This test determines the statistical significance of each cycle and filters out the insignificant cycles. The significant cycles are stored in the cycleBartelsBuffer array. If the SortBartels flag is set, the code sorts the significant cycles based on their Bartels significance values.
Waveform calculation:
The Goertzel Browser code calculates the waveform of the significant cycles for both past and future time windows. The past and future windows are defined by the WindowSizePast and WindowSizeFuture parameters, respectively. The algorithm uses either cosine or sine functions (controlled by the useCosine flag) to calculate the waveforms for each cycle. The useAddition flag determines whether the waveforms should be added or subtracted.
Storing waveforms in matrices:
The calculated waveforms for each cycle are stored in two matrices - goeWorkPast and goeWorkFuture. These matrices hold the waveforms for the past and future time windows, respectively. Each row in the matrices represents a time window position, and each column corresponds to a cycle.
Returning the number of cycles:
The Goertzel Browser function returns the total number of detected cycles (number_of_cycles) after processing the input data. This information can be used to further analyze the results or to visualize the detected cycles.
The Goertzel Browser code is a comprehensive implementation of the Goertzel Algorithm, specifically designed for detecting and analyzing dominant cycles within financial market data. The code offers a high level of customization, allowing users to fine-tune the algorithm based on their specific needs. The Goertzel Browser's combination of preprocessing, iterative calculations, cycle extraction, sorting, significance testing, and waveform calculation makes it a powerful tool for understanding cyclical components in financial data.
█ Generating and Visualizing Composite Waveform
The indicator calculates and visualizes the composite waveform for both past and future time windows based on the detected cycles. Here's a detailed explanation of this process:
Updating WindowSizePast and WindowSizeFuture:
The WindowSizePast and WindowSizeFuture are updated to ensure they are at least twice the MaxPer (maximum period).
Initializing matrices and arrays:
Two matrices, goeWorkPast and goeWorkFuture, are initialized to store the Goertzel results for past and future time windows. Multiple arrays are also initialized to store cycle, amplitude, phase, and Bartels information.
Preparing the source data (srcVal) array:
The source data is copied into an array, srcVal, and detrended using one of the selected methods (hpsmthdt, zlagsmthdt, logZlagRegression, hpsmth, or zlagsmth).
Goertzel function call:
The Goertzel function is called to analyze the detrended source data and extract cycle information. The output, number_of_cycles, contains the number of detected cycles.
Initializing arrays for past and future waveforms:
Three arrays, epgoertzel, goertzel, and goertzelFuture, are initialized to store the endpoint Goertzel, non-endpoint Goertzel, and future Goertzel projections, respectively.
Calculating composite waveform for past bars (goertzel array):
The past composite waveform is calculated by summing the selected cycles (either from the user-defined cycle list or the top cycles) and optionally subtracting the noise component.
Calculating composite waveform for future bars (goertzelFuture array):
The future composite waveform is calculated in a similar way as the past composite waveform.
Drawing past composite waveform (pvlines):
The past composite waveform is drawn on the chart using solid lines. The color of the lines is determined by the direction of the waveform (green for upward, red for downward).
Drawing future composite waveform (fvlines):
The future composite waveform is drawn on the chart using dotted lines. The color of the lines is determined by the direction of the waveform (fuchsia for upward, yellow for downward).
Displaying cycle information in a table (table3):
A table is created to display the cycle information, including the rank, period, Bartel value, amplitude (or cycle strength), and phase of each detected cycle.
Filling the table with cycle information:
The indicator iterates through the detected cycles and retrieves the relevant information (period, amplitude, phase, and Bartel value) from the corresponding arrays. It then fills the table with this information, displaying the values up to six decimal places.
To summarize, this indicator generates a composite waveform based on the detected cycles in the financial data. It calculates the composite waveforms for both past and future time windows and visualizes them on the chart using colored lines. Additionally, it displays detailed cycle information in a table, including the rank, period, Bartel value, amplitude (or cycle strength), and phase of each detected cycle.
█ Enhancing the Goertzel Algorithm-Based Script for Financial Modeling and Trading
The Goertzel algorithm-based script for detecting dominant cycles in financial data is a powerful tool for financial modeling and trading. It provides valuable insights into the past behavior of these cycles and potential future impact. However, as with any algorithm, there is always room for improvement. This section discusses potential enhancements to the existing script to make it even more robust and versatile for financial modeling, general trading, advanced trading, and high-frequency finance trading.
Enhancements for Financial Modeling
Data preprocessing: One way to improve the script's performance for financial modeling is to introduce more advanced data preprocessing techniques. This could include removing outliers, handling missing data, and normalizing the data to ensure consistent and accurate results.
Additional detrending and smoothing methods: Incorporating more sophisticated detrending and smoothing techniques, such as wavelet transform or empirical mode decomposition, can help improve the script's ability to accurately identify cycles and trends in the data.
Machine learning integration: Integrating machine learning techniques, such as artificial neural networks or support vector machines, can help enhance the script's predictive capabilities, leading to more accurate financial models.
Enhancements for General and Advanced Trading
Customizable indicator integration: Allowing users to integrate their own technical indicators can help improve the script's effectiveness for both general and advanced trading. By enabling the combination of the dominant cycle information with other technical analysis tools, traders can develop more comprehensive trading strategies.
Risk management and position sizing: Incorporating risk management and position sizing functionality into the script can help traders better manage their trades and control potential losses. This can be achieved by calculating the optimal position size based on the user's risk tolerance and account size.
Multi-timeframe analysis: Enhancing the script to perform multi-timeframe analysis can provide traders with a more holistic view of market trends and cycles. By identifying dominant cycles on different timeframes, traders can gain insights into the potential confluence of cycles and make better-informed trading decisions.
Enhancements for High-Frequency Finance Trading
Algorithm optimization: To ensure the script's suitability for high-frequency finance trading, optimizing the algorithm for faster execution is crucial. This can be achieved by employing efficient data structures and refining the calculation methods to minimize computational complexity.
Real-time data streaming: Integrating real-time data streaming capabilities into the script can help high-frequency traders react to market changes more quickly. By continuously updating the cycle information based on real-time market data, traders can adapt their strategies accordingly and capitalize on short-term market fluctuations.
Order execution and trade management: To fully leverage the script's capabilities for high-frequency trading, implementing functionality for automated order execution and trade management is essential. This can include features such as stop-loss and take-profit orders, trailing stops, and automated trade exit strategies.
While the existing Goertzel algorithm-based script is a valuable tool for detecting dominant cycles in financial data, there are several potential enhancements that can make it even more powerful for financial modeling, general trading, advanced trading, and high-frequency finance trading. By incorporating these improvements, the script can become a more versatile and effective tool for traders and financial analysts alike.
█ Understanding the Limitations of the Goertzel Algorithm
While the Goertzel algorithm-based script for detecting dominant cycles in financial data provides valuable insights, it is important to be aware of its limitations and drawbacks. Some of the key drawbacks of this indicator are:
Lagging nature:
As with many other technical indicators, the Goertzel algorithm-based script can suffer from lagging effects, meaning that it may not immediately react to real-time market changes. This lag can lead to late entries and exits, potentially resulting in reduced profitability or increased losses.
Parameter sensitivity:
The performance of the script can be sensitive to the chosen parameters, such as the detrending methods, smoothing techniques, and cycle detection settings. Improper parameter selection may lead to inaccurate cycle detection or increased false signals, which can negatively impact trading performance.
Complexity:
The Goertzel algorithm itself is relatively complex, making it difficult for novice traders or those unfamiliar with the concept of cycle analysis to fully understand and effectively utilize the script. This complexity can also make it challenging to optimize the script for specific trading styles or market conditions.
Overfitting risk:
As with any data-driven approach, there is a risk of overfitting when using the Goertzel algorithm-based script. Overfitting occurs when a model becomes too specific to the historical data it was trained on, leading to poor performance on new, unseen data. This can result in misleading signals and reduced trading performance.
No guarantee of future performance: While the script can provide insights into past cycles and potential future trends, it is important to remember that past performance does not guarantee future results. Market conditions can change, and relying solely on the script's predictions without considering other factors may lead to poor trading decisions.
Limited applicability: The Goertzel algorithm-based script may not be suitable for all markets, trading styles, or timeframes. Its effectiveness in detecting cycles may be limited in certain market conditions, such as during periods of extreme volatility or low liquidity.
While the Goertzel algorithm-based script offers valuable insights into dominant cycles in financial data, it is essential to consider its drawbacks and limitations when incorporating it into a trading strategy. Traders should always use the script in conjunction with other technical and fundamental analysis tools, as well as proper risk management, to make well-informed trading decisions.
█ Interpreting Results
The Goertzel Browser indicator can be interpreted by analyzing the plotted lines and the table presented alongside them. The indicator plots two lines: past and future composite waves. The past composite wave represents the composite wave of the past price data, and the future composite wave represents the projected composite wave for the next period.
The past composite wave line displays a solid line, with green indicating a bullish trend and red indicating a bearish trend. On the other hand, the future composite wave line is a dotted line with fuchsia indicating a bullish trend and yellow indicating a bearish trend.
The table presented alongside the indicator shows the top cycles with their corresponding rank, period, Bartels, amplitude or cycle strength, and phase. The amplitude is a measure of the strength of the cycle, while the phase is the position of the cycle within the data series.
Interpreting the Goertzel Browser indicator involves identifying the trend of the past and future composite wave lines and matching them with the corresponding bullish or bearish color. Additionally, traders can identify the top cycles with the highest amplitude or cycle strength and utilize them in conjunction with other technical indicators and fundamental analysis for trading decisions.
This indicator is considered a repainting indicator because the value of the indicator is calculated based on the past price data. As new price data becomes available, the indicator's value is recalculated, potentially causing the indicator's past values to change. This can create a false impression of the indicator's performance, as it may appear to have provided a profitable trading signal in the past when, in fact, that signal did not exist at the time.
The Goertzel indicator is also non-endpointed, meaning that it is not calculated up to the current bar or candle. Instead, it uses a fixed amount of historical data to calculate its values, which can make it difficult to use for real-time trading decisions. For example, if the indicator uses 100 bars of historical data to make its calculations, it cannot provide a signal until the current bar has closed and become part of the historical data. This can result in missed trading opportunities or delayed signals.
█ Conclusion
The Goertzel Browser indicator is a powerful tool for identifying and analyzing cyclical patterns in financial markets. Its ability to detect multiple cycles of varying frequencies and strengths make it a valuable addition to any trader's technical analysis toolkit. However, it is important to keep in mind that the Goertzel Browser indicator should be used in conjunction with other technical analysis tools and fundamental analysis to achieve the best results. With continued refinement and development, the Goertzel Browser indicator has the potential to become a highly effective tool for financial modeling, general trading, advanced trading, and high-frequency finance trading. Its accuracy and versatility make it a promising candidate for further research and development.
█ Footnotes
What is the Bartels Test for Cycle Significance?
The Bartels Cycle Significance Test is a statistical method that determines whether the peaks and troughs of a time series are statistically significant. The test is named after its inventor, George Bartels, who developed it in the mid-20th century.
The Bartels test is designed to analyze the cyclical components of a time series, which can help traders and analysts identify trends and cycles in financial markets. The test calculates a Bartels statistic, which measures the degree of non-randomness or autocorrelation in the time series.
The Bartels statistic is calculated by first splitting the time series into two halves and calculating the range of the peaks and troughs in each half. The test then compares these ranges using a t-test, which measures the significance of the difference between the two ranges.
If the Bartels statistic is greater than a critical value, it indicates that the peaks and troughs in the time series are non-random and that there is a significant cyclical component to the data. Conversely, if the Bartels statistic is less than the critical value, it suggests that the peaks and troughs are random and that there is no significant cyclical component.
The Bartels Cycle Significance Test is particularly useful in financial analysis because it can help traders and analysts identify significant cycles in asset prices, which can in turn inform investment decisions. However, it is important to note that the test is not perfect and can produce false signals in certain situations, particularly in noisy or volatile markets. Therefore, it is always recommended to use the test in conjunction with other technical and fundamental indicators to confirm trends and cycles.
Deep-dive into the Hodrick-Prescott Fitler
The Hodrick-Prescott (HP) filter is a statistical tool used in economics and finance to separate a time series into two components: a trend component and a cyclical component. It is a powerful tool for identifying long-term trends in economic and financial data and is widely used by economists, central banks, and financial institutions around the world.
The HP filter was first introduced in the 1990s by economists Robert Hodrick and Edward Prescott. It is a simple, two-parameter filter that separates a time series into a trend component and a cyclical component. The trend component represents the long-term behavior of the data, while the cyclical component captures the shorter-term fluctuations around the trend.
The HP filter works by minimizing the following objective function:
Minimize: (Sum of Squared Deviations) + λ (Sum of Squared Second Differences)
Where:
The first term represents the deviation of the data from the trend.
The second term represents the smoothness of the trend.
λ is a smoothing parameter that determines the degree of smoothness of the trend.
The smoothing parameter λ is typically set to a value between 100 and 1600, depending on the frequency of the data. Higher values of λ lead to a smoother trend, while lower values lead to a more volatile trend.
The HP filter has several advantages over other smoothing techniques. It is a non-parametric method, meaning that it does not make any assumptions about the underlying distribution of the data. It also allows for easy comparison of trends across different time series and can be used with data of any frequency.
However, the HP filter also has some limitations. It assumes that the trend is a smooth function, which may not be the case in some situations. It can also be sensitive to changes in the smoothing parameter λ, which may result in different trends for the same data. Additionally, the filter may produce unrealistic trends for very short time series.
Despite these limitations, the HP filter remains a valuable tool for analyzing economic and financial data. It is widely used by central banks and financial institutions to monitor long-term trends in the economy, and it can be used to identify turning points in the business cycle. The filter can also be used to analyze asset prices, exchange rates, and other financial variables.
The Hodrick-Prescott filter is a powerful tool for analyzing economic and financial data. It separates a time series into a trend component and a cyclical component, allowing for easy identification of long-term trends and turning points in the business cycle. While it has some limitations, it remains a valuable tool for economists, central banks, and financial institutions around the world.
在脚本中搜索"take profit"

Andromeda Indicator [Loxx]Andromeda Indicator is a lower timeframe, high-leverage scalping indicator tuned to Cryptocurrency futures trading. It works by scanning for volatility spikes and then calculation the likelihood that those spikes will break market structure to the upside or downside. This indicator is to be paired with Andromeda strategy found here:
This indicator contains alerts that correspond to signals from the strategy. Both indicators should be used on the chart at the same time.
Notable Settings
Volatility Type: ATR or TRD , these types will be expanded in future releases.
Signal Speed: How quickly you'd like signals to flow in
Number of Take Profits: How many take profits levels. 1-5
Show dip buying levels: If you have a high risk appetite, these are levels where you could increase your investment size, this has no effect on the indicator but is included for if you wish to manually add to your position size
Activate Longs?: Toggles on/off Longs
Activate Longs?: Toggles on/off Shorts
UI components
Big green and red plus signs means an entry point. PTF with green and red arrows means "prepare for trend flip". Not every PTF will actually flip the trend. These are just warning shots to make you aware that a possible trend flip is coming. Labels nest to market structure breaks with numbers are the ideal entry level. You can set limit orders at these levels so as to incur less exchange fees on Binance or Bybit for example. The data window provides useful information about the current trade and targets and stoploss of the next upcoming trade giving the current price action of the asset.
Other things to note
this is an extremely high risk indicator depending on how you tune the settings. You can tune down the settings to make it less risky at the cost of profit and hit rate, but that's up to you and your trading style. This can be used all all timeframes, but is meant for timeframes below 4 hours.

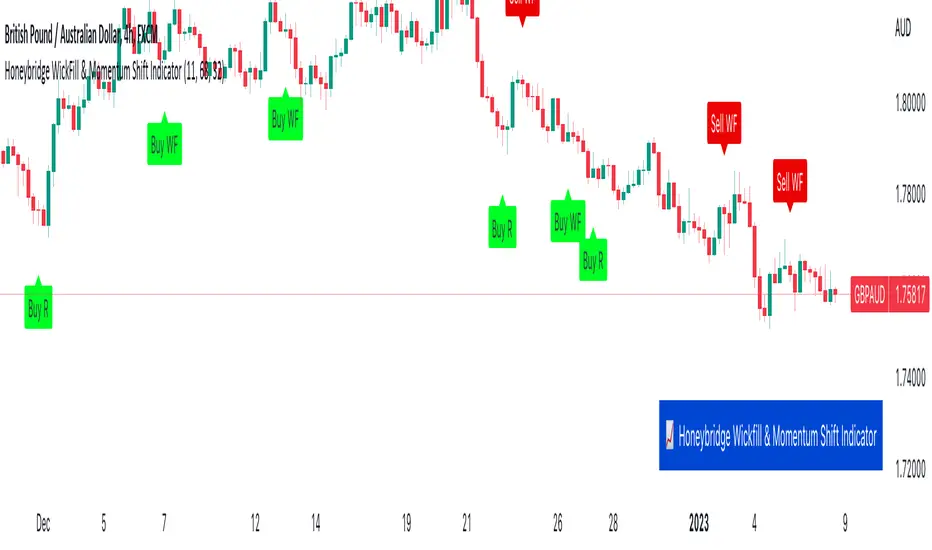
Honeybridge WickFill & Momentum Shift IndicatorAs the creator of this script, I am proud to introduce the "Honeybridge WickFill & Momentum Shift Indicator," a powerful tool for traders looking to capitalize on market opportunities using these two proven strategies.
WICK FILLS
First, let's take a closer look at the WickFill method. In financial markets, candlestick charts are a popular way to visualize the price movement of a security, derivative, or currency over a specific time period. Each candlestick on the chart is composed of a real body and shadows, with the top of the upper shadow representing the highest price paid during the time period, and the bottom of the lower shadow representing the lowest price paid.
The WickFill method involves placing market orders at the closed price indicated by the candlestick. This means that if a trader using this method sees a long upper wick on a bullish candlestick chart, they may place a buy market order at the closed price of the candlestick with the take profit target at the candlestick high price (the highest price paid during the time period), in the belief that the price is likely to rise. Similarly, if they see a long lower wick on a bearish candle, they may place a sell market order at the closed price of the candlestick with the take profit target at the candlestick low price (the lowest price paid during the time period), in the belief that the price is likely to fall.
The idea behind the WickFill method is that the wicks of candlestick chart patterns can provide valuable information about the price action of a security and the sentiment of market participants. By placing market orders at the prices indicated by the candlesticks close, traders using this method hope to capitalize on potential price movements and maximize their returns.
The image below highlights two Wick Fill opportunities. A signal will be provided at the candle close that says: 'Sell WF' or 'Buy WF'.
--------------
MOMENTUM SHIFT REVERSAL
Now, let's turn to the Momentum Shift method. As the name suggests, this method involves identifying changes in the momentum of the price of a security. Traders who use this method are looking to capitalize on shifts in the strength or direction of the price momentum.
There are various ways to trade based on momentum shifts. For example, a trader may look for a security whose price is trending strongly in one direction and then look for a momentum shift that signals a change in the trend. They may then enter a trade in the direction of the new trend, hoping to ride the momentum of the price movement. Alternatively, a trader may look for a security whose price is moving in a range and then look for a momentum shift that signals a breakout from the range. They may then enter a trade in the direction of the breakout, hoping to capitalize on the momentum of the price movement.
--------------
WICK REJECTION REVERSALS
A second Momentum Shift method is the concept of wick rejection reversal trading opportunities. This is a powerful technique for traders looking to capitalize on market opportunities.
So, what exactly is a wick rejection reversal opportunity? Essentially, it is a situation in which the price of a security rejects a wick (or shadow or tail) of a candlestick chart pattern and then reverses direction. For example, if the price is trending upwards and then encounters resistance at a certain level, it may create a long upper wick on a candlestick chart. If the price then falls back below the level of resistance and continues trending downwards, this could be considered a wick rejection reversal opportunity.
Traders can use the Indicator and signals provided to identify wick rejection reversal opportunities by defining certain conditions. For example, the code includes conditions for identifying a "sell reversal" based on the presence of a green candle with a long upper wick, and an RSI value above a certain threshold. This type of setup may indicate that the price is rejecting the resistance represented by the long upper wick and is likely to continue trending downwards.
Similarly, the code includes conditions for identifying a "buy reversal" based on the presence of a red candle with a long lower wick, and an RSI value below a certain threshold. This type of setup may indicate that the price is rejecting the support represented by the long lower wick and is likely to continue trending upwards.
Traders can find wick rejection reversal opportunities particularly beneficial for several reasons. First, these opportunities can provide clear entry and exit points for trades, which can help traders manage risk and maximize their returns. By identifying a specific level of resistance or support that has been rejected by the price, traders can have a clear idea of where to place their orders and where to set their stop-losses.
Second, wick rejection reversal opportunities can be a reliable indicator of market sentiment and direction. By considering the wicks of candlestick chart patterns, traders can gain a deeper understanding of the forces at work in the market and how market participants are reacting to them. This can help traders make more informed decisions about when to enter or exit trades.
Finally, wick rejection reversal opportunities can be found in a variety of market conditions and across different financial instruments. Whether the market is trending, range-bound, or volatile, traders can use this indicator provided to identify wick rejection reversal opportunities and capitalize on them.
In conclusion, wick rejection reversal opportunities are a valuable technique for traders looking to capitalize on market opportunities and improve their returns. By using the indicator provided and considering the wicks of candlestick chart patterns, traders can identify clear entry and exit points, understand market sentiment, and trade across different market conditions and instruments.
The image below depicts two sell opportunities, the top left is a Momentum Shift example and the top right is a Wick Rejection example. A signal will be shown on the chart at the candle close that says: 'Sell R' or 'Buy R'.
--------------
CONCLUSION
So why might traders find the WickFill and Momentum Shift methods useful? There are several reasons. First, these methods can help traders identify potential trade opportunities that may not be immediately apparent from a simple analysis of price trends or chart patterns. By considering the wicks and momentum of a security's price movement, traders can gain a more nuanced understanding of the forces at work in the market and make more informed decisions about when to enter or exit trades.
Second, the WickFill and Momentum Shift methods can be used in conjunction with other technical analysis tools and techniques. For example, traders may use moving averages, oscillators, and trendlines to help confirm the presence of a WickFill or Momentum Shift opportunity. This can help traders increase the reliability and profitability of their trades.
Finally, the WickFill and Momentum Shift methods can be applied to a wide range of financial instruments, including stocks, forex, futures, and more. This versatility makes them useful for traders with diverse investment portfolios and strategies.
Overall, the WickFill and Momentum Shift methods are powerful tools for traders looking to capitalize on market opportunities and improve their returns. By considering the wicks and momentum of a security's price movement, traders can find profitable trading opportunities.
------------
FINAL COMMENT
Just like any other indicator or strategy out there, please consider the timeframe and asset that you are using this indicator with. Higher timeframe price action is more reliable than lower timeframe price action. For example, the 4H and Daily timeframes will provide more reliable signals than the 5m timeframe. With regards to assets, the indicator works extremely well with Forex pairs and Commodities, such as Gold.
I hope you enjoy the indicator.
MACD Strategy - Backtest [AlgoRider]█ OVERVIEW
Hello dear Tradingviewers !
We are excited to share with you this new indicator which simulates a trading strategy based solely on the well-known technical indicator MACD . We designed it for the sole educational and analytical purposes of showing novice traders and new investors that basing a trading strategy only on one such technical indicator is not necessarily a good thing to do. We do not recommend to apply this strategy for real.
Thanks to this indicator redesigned in our own way by incorporating our simple and easy-to-use Backtest functionality, you will be able to see and report on the performance and results that such a strategy has produced in the past.
The configuration window has also been designed to be easily readable and simple to use. Our goal is to make parameter customization as easy as possible.
█ HOW THE STRATEGY WORKS
• The script will simply trigger Long entries when bullish MACD crossings appear (the Macd line crosses the Signal line upwards) and Short entries when bearish MACD crossings appear (the Macd line crosses below the signal line).
• A Short signal ends a Long trade, a Long signal ends a Short trade.
• The script also allows setting up custom TP and SL.
• An option allows you to trigger early crossings, which will influence entries and exits.
• There is no repaint, once an entry/exit symbol or drawing is displayed it doesn't change anymore. The Short and Long signals appear at the open of the candles, just after the signal was confirmed at the close of the previous candle. The custom TP and custom SL signals can appear when a candle is not yet finished, but once displayed they don't change.
█ HOW TO PROCEED
1 — Once the script is applied to your chart, it already works with its default settings. You can already see the performance of the strategy in the data table directly on the chart (in the top right corner by default).
2 — You can customize the strategy and influence the results/performance by modifying its parameters. 3 types of parameters are present and can be modified.
3 — You can use this indicator in all types of markets.
4 — You can apply the script in every timeframe.
█ PARAMETERS
• Settings For Backtesting
- Strategy : Choose from a drop-down list if the strategy should execute only Long trades or only Short trades or both. Default Both.
- Invest. : Choose the amount you want to invest in the simulation. Default 10000.
- Position : Choose the amount of the position (Size order) that will be used during the simulation. This will be the $ amount staked/involved for each trade entry.
Ex: If you put 20000 in position and 10000 in Invest. We consider that you use at least a leverage x2. Default 10000.
- Slipp. TP : Choose the amount in percentage of average slippage for Take Profits. This parameter makes it possible to predict a potential gap between the theoretical exit price for each TP (On the graph) and the real exit price on an exchange when implementing the strategy for real (slippage may be due to a time lag of a few seconds from execution time of the order on the exchange and/or due to the execution of a market order).
Ex: If a TP exit order of a Long trade, with entry $19000 (on BTCUSDT ), is carried out in theory on the chart at $20000, in practice on the exchange the script have indeed sent an exit order at 20000 , but if the true exit price is 20050, the TP slippage is then +0.25%. Default 0.
- Slipp. SL : Choose the amount in percentage of average slippage for Stop Losses. This parameter makes it possible to predict a potential gap between the theoretical exit price for each SL (On the graph) and the real exit price on an exchange when implementing the strategy for real.
Ex: If an SL exit order of a Long trade, entry $19000 (on BTCUSDT ), is carried out in theory on the chart at $18000, in practice on the exchange the script have indeed sent an exit order at 18000 $, but if the true exit price is 17950, the slippage SL is then +0.278%. Default 0.
- Fees % : Choose the percentage amount of fees applied to each trade to simulate the application of the strategy on the exchange of your choice. Applies to the entry and exit of each trade. Ex: For Binance Futures: 0.04; For Bybit futures: 0.06; For Ftx Futures: 0.075. Default 0.
- Cumulate Trades : If you check this, the Backtest will use 100% of the balance as Order Size (Position) for All or in the next X consecutive trades. Default not checked.
⚠️ Be Careful please, this option is available to show the full extent and possibilities of the algorithm when pushed to its limits thanks to the accumulation of profits (cumulative earnings ), but it is a strategy that involves great risk. If a bad trade suffers a -50% loss, 50% of the account balance is lost, if the position is liquidated, the entire account balance is lost.
- All : If you check this All trades will be accumulated. Default not checked.
- Consecutive Trades : Choose the number of trades to accumulate. After X consecutive trades, the algorithm reassigns the initial order size to the current one and starts again for X consecutive trades. Minimum Value 2, Default 2.
• Settings To Optimize Performances and Risk Management
- Fast_MA : Choose the length of the Fast Moving Average. Default 12.
- Slow_MA : Choose the length of the Slow Moving Average. Default 26.
- Enable Early Crossings : If you check this, when the algorithm will detect an early crossing wethere bullish or bearish , it will trigger the Long or Short entries. Default not checked.
- Oscillator MA Type : Choose if the Macd line should be an Exponential Moving Average or a Simple Moving Average . Default Expo.
- Signal Line MA Type : Choose if the Signal line should be an Exponential Moving Average or a Simple Moving Average . Default Expo.
- Use TP / Use SL : If you check these, the algorithm will trigger personalized trade exit signals when the price evolution has reached the amounts indicated since the trade entry. Default not Checked.
- % TP - SL : Indicate here the personalized amount in percentage that you want for your Take Profit and Stop Loss of each trade. Default 15-5.
• Settings For Appearances
- Small-size Data Table : If you check this, the data table will become smaller to free up more space on the chart to make it visually more pleasing. Default not checked.
Hide Table /
- Hide Labels / : You can check these to get a cleaner chart and focus only on what interests you in the indicator. Default not checked.
Hide Risk-Reward Areas
█ LIMITATIONS
• ⚠️ We repeat it once again, this strategy is not intended to be reproduced in real conditions, we have designed it for educational and analytical purposes only.
• Even if you see good performances when you backtest the strategy, you must take into account that these results are performed in the past and that in no case does this guarantee that these same performances will be repeated again in the future.
• When you run for real a trading strategy you must be aware of the fact that you are solely responsible for the results that you will be able to obtain and you must be aware of the possibility at all times of partial or even total losses of your invested capital.
• Keep in mind that generating profits in trading is difficult. A strategy can perform very well at one time in the past during a period that is favorable to it, then from one day to the next it can give really bad results for several months or years.
• When backtesting a trading strategy, there are many factors to consider, not just trade entries to which you add a Take Profit and sometimes a Stop Loss. You must at least take into account the size of the position in relation to the capital you want to invest, the trading fees, the slippages (which can be really important depending on the exchange on which you are trading and depending on the asset you are trading), trading frequency, risk management, momentum, volumes and even more.
The information published here on TradingView is not prohibited, doesn't constitute investment advice, and isn't created solely for qualified investors.
═════════════════════════════════════════════════════════════════════════
Important to note : our indicators with the same backtesting system are published in separate publications, because putting them together in a single script would considerably slow down the execution of the script. In addition each indicator, even when it is based on a simple technical indicator, has several options, parameters and entry/exit conditions specific to the underlying technical indicator. Finally, we want to keep the simplicity of use, configuration and understanding of our indicator by not mixing strategies that have nothing to do with each other.
RSI Strategy - Backtest [AlgoRider]█ OVERVIEW
Hello dear Tradingviewers !
We share with you this new indicator which simulates a trading strategy based solely on the well-known technical indicator RSI . We designed it for the sole educational and analytical purposes of showing novice traders and new investors that basing a trading strategy only on one such technical indicator is not necessarily a good thing to do. We do not recommend to apply this strategy for real.
Thanks to this indicator redesigned in our own way by incorporating our simple and easy-to-use Backtest functionality, you will be able to see and report on the performance and results that such a strategy has produced in the past.
The configuration window has also been designed to be easily readable and simple to use. Our goal is to make parameter customization as easy as possible.
█ HOW THE STRATEGY WORKS
• The script will trigger Long entries when the price crosses upwards the Oversold zone (Default 38.2) and Short entries when the price crosses downward the Overbought zone (Default 61.8).
• A Short signal ends a Long trade, a Long signal ends a Short trade.
• The script also allows setting up custom TP and SL.
• Several options allow you to reverse entry and exit conditions of trades. You can choose to reverse entries or/and exits (Ex: when the script detects a Long Entry, it will actually trigger a Short trade).
• You can also change the entry conditions of the strategy. Instead of entering oversold/overbought zone conditions, it will trigger entries when the Rsi changes direction and reverses (Ex: when the rsi has been going down for 5 candles, and the rsi starts going up) , regardless of the area in which the RSI is located.
• There is no repaint, once an entry/exit symbol or drawing is displayed it doesn't change anymore. The Short and Long signals appear at the open of the candles, just after the signal was confirmed at the close of the previous candle. The custom TP and custom SL signals can appear when a candle is not yet finished, but once displayed they don't change.
█ HOW TO PROCEED
1 — Once the script is applied to your chart, it already works with its default settings. You can already see the performance of the strategy in the data table directly on the chart (in the top right corner by default).
2 — You can customize the strategy and influence the results/performance by modifying its parameters. 4 types of parameters are present and can be modified.
3 — You can use this indicator in all types of markets.
4 — You can apply the script in every timeframe.
█ PARAMETERS
• Settings For Backtesting
- Strategy : Choose from a drop-down list if the strategy should execute only Long trades or only Short trades or both. Default Both.
- Invest. : Choose the amount you want to invest in the simulation. Default 10000.
- Position : Choose the amount of the position (Size order) that will be used during the simulation. This will be the $ amount staked/involved for each trade entry.
Ex: If you put 20000 in position and 10000 in Invest. We consider that you use at least a leverage x2. Default 10000.
- Slipp. TP : Choose the amount in percentage of average slippage for Take Profits. This parameter makes it possible to predict a potential gap between the theoretical exit price for each TP (On the graph) and the real exit price on an exchange when implementing the strategy for real (slippage may be due to a time lag of a few seconds from execution time of the order on the exchange and/or due to the execution of a market order).
Ex: If a TP exit order of a Long trade, with entry $19000 (on BTCUSDT ), is carried out in theory on the chart at $20000, in practice on the exchange the script have indeed sent an exit order at 20000 , but if the true exit price is 20050, the TP slippage is then +0.25%. Default 0.
- Slipp. SL : Choose the amount in percentage of average slippage for Stop Losses. This parameter makes it possible to predict a potential gap between the theoretical exit price for each SL (On the graph) and the real exit price on an exchange when implementing the strategy for real.
Ex: If an SL exit order of a Long trade, entry $19000 (on BTCUSDT ), is carried out in theory on the chart at $18000, in practice on the exchange the script have indeed sent an exit order at 18000 $, but if the true exit price is 17950, the slippage SL is then +0.278%. Default 0.
- Fees % : Choose the percentage amount of fees applied to each trade to simulate the application of the strategy on the exchange of your choice. Applies to the entry and exit of each trade. Ex: For Binance Futures: 0.04; For Bybit futures: 0.06; For Ftx Futures: 0.075. Default 0.
- Cumulate Trades : If you check this, the Backtest will use 100% of the balance as Order Size (Position) for All or in the next X consecutive trades. Default not checked.
⚠️ Be Careful please, this option is available to show the full extent and possibilities of the algorithm when pushed to its limits thanks to the accumulation of profits (cumulative earnings ), but it is a strategy that involves great risk. If a bad trade suffers a -50% loss, 50% of the account balance is lost, if the position is liquidated, the entire account balance is lost.
- All : If you check this All trades will be accumulated. Default not checked.
- Consecutive Trades : Choose the number of trades to accumulate. After X consecutive trades, the algorithm reassigns the initial order size to the current one and starts again for X consecutive trades. Minimum Value 2, Default 2.
• Change Entry & Exit conditions
- Rsi Turns Up/Down : Enable this option to change conditions for trade entries. For Long entries : It will start a Long trade when RSI turns up and the RSI was falling on the last X bar(s). For Short entries : It will start a Short trade when RSI turns down and the RSI was rising on the last X bar(s). Default not checked.
- After Falling/Rising Bars(s) : Choose the number of bars/candles since which the price was falling/rising. Default 5.
- Reverse Entries : Enable this option to reverse conditions for trade entries. When a Short signal appears, it will actually start a Long trade. When a Long signal appears, it will actually start a Short trade. Default not checked.
- Reverse Exits : Enable this option to reverse conditions for trade exits. Default not checked.
- Safety Stop Loss : Enable this option to quickly cut the trade when the price turns quickly. For a Long trade : if the price returns to the oversold zone, it ends the trade. For a Short trade : if the price returns to the overbought zone, it ends the trade. Mainly useful for basic strategy (overbought/oversold conditions). Default not checked.
• Settings To Optimize Performances and Risk Management
- Len RSI : The length of RSI . Default 14.
- Overbuy : You can change the limit value of the overbought zone of the RSI . Default 61.8.
- Oversell : You can change the limit value of the oversell zone of the RSI . Default 38.2.
- Use TP / Use SL : If you check these, the algorithm will trigger personalized trade exit signals when the price evolution has reached the amounts indicated since the trade entry. Default not Checked.
- % TP - SL : Indicate here the personalized amount in percentage that you want for your Take Profit and Stop Loss of each trade. Default 15-5.
• Settings For Appearances
- Small-size Data Table : If you check this, the data table will become smaller to free up more space on the chart to make it visually more pleasing. Default not checked.
Hide Table /
- Hide Labels / : You can check these to get a cleaner chart and focus only on what interests you in the indicator. Default not checked.
Hide Risk-Reward Areas
█ LIMITATIONS
• ⚠️ We repeat it once again, this strategy is not intended to be reproduced in real conditions, we have designed it for educational and analytical purposes only.
• Even if you see good performances when you backtest the strategy, you must take into account that these results are performed in the past and that in no case does this guarantee that these same performances will be repeated again in the future.
• When you run for real a trading strategy you must be aware of the fact that you are solely responsible for the results that you will be able to obtain and you must be aware of the possibility at all times of partial or even total losses of your invested capital.
• Keep in mind that generating profits in trading is difficult. A strategy can perform very well at one time in the past during a period that is favorable to it, then from one day to the next it can give really bad results for several months or years.
• When backtesting a trading strategy, there are many factors to consider, not just trade entries to which you add a Take Profit and sometimes a Stop Loss. You must at least take into account the size of the position in relation to the capital you want to invest, the trading fees, the slippages (which can be really important depending on the exchange on which you are trading and depending on the asset you are trading), trading frequency, risk management, momentum, volumes and even more.
The information published here on TradingView is not prohibited, doesn't constitute investment advice, and isn't created solely for qualified investors.
═════════════════════════════════════════════════════════════════════════
Important to note : our indicators with the same backtesting system are published in separate publications, because putting them together in a single script would considerably slow down the execution of the script. In addition each indicator, even when it is based on a simple technical indicator, has several options, parameters and entry/exit conditions specific to the underlying technical indicator. Finally, we want to keep the simplicity of use, configuration and understanding of our indicator by not mixing strategies that have nothing to do with each other.

Chameleon [FST]
This is a Technical Trading strategy with multiple technical indicators as confirmations.
Indicators
MA
EMA
ATR
OSCILLATOR
DESCRIPTION
Inputs
Risk/Reward ratio . Stop Loss and Take profit price distance is the same, i.e. SL 25 pips, TP 25 pips. You can increase the profit target ideally for an Experienced trader; for example, using 25 pips stop Loss & 37.5 pips take profit or 25 pips stop Loss & 50 pips take profit.
SETTINGS
Look back 1 & 2. Look back at 'period', and this help to filter how many bars to a trend. Look-back 1&2 are a form of moving average and exponential moving average calculation.
Look back 1 filter longer-term-trend.
Look back 2 filter short-term-trend.
SAP.M.A
Period . This helps to process possible areas of entry if a trend is confirmed.
SAP Multiplier . This helps us to calculate the possible area of early or late entry and take-profit/stop-loss price.
Style
Channel Ten-Top & Bottom= Two EMA Period 10, Source High and Source Low forming a channel (optional).
How to use the Signals as seen in the attached screenshot
1. You can apply trendline channels to trade the signals only if the price movement is in the channel.
2. Apply Support and Resistant line to assist. For Uptrend=Apply support line, look for a Buy signal and Downtrend= Apply Resistant line, look for a sell signal
3. With the help of this indicator, you can use it to filter your strategy entries.
4. If you understand technical analysis plus trend trading, you can increase the Reward to maximise the potential profit target.
The above indicators description identifies market trends with optional visual risk to reward and buy/sell alerts on the chart.
Available on all time frames.
The "Buy and Sell Confirmation" is a composite indicator of Moving Averages, which triggers technical signals when it crosses MA, EMA and OSCILLATORS above (to buy) or below (to sell) its signal line if the price above or below the indicator transformed into a trend, which is taken as a signal of buy and sell.
The Auto generates R: R "risk to reward" is well calculated; these can help beginners know where to place their Take Profit and Stop Loss, erasing that fear of what to do next.
The indicator is for every type of market: indices, stocks, cryptocurrencies, currencies and others.
Most traders don't know when to ride the trend or get out of a losing/winning trade.
This trading system will eliminate 70% of the doubt about the above.
This strategy is not a guaranteed profit. Therefore, it is recommended that you should backtest or trade virtual money before using this study on your entire portfolio, as it is intended to be a tool and not a holy grail.
Beware of the ranging/consolidation market to avoid false signals.
Disclaimer: Trading and investing in the Forex, Stock Market and Cryptocurrencies involves substantial risk of Loss and is not suitable for every investor. The content covered in this study is NOT to be considered investment advice. I'm NOT a financial adviser. All trading strategies are used at your own risk.

vStrat Algo 2.0vStrat Algo 2.0 is a Non-Repainting toolkit that works on any market such as stocks, crypto, forex, indices, commodities, etc. There are 8 advanced features that traders can use to help them create their own strategies. vStrat Algo 2.0 offers 10 sensitivity presets that they can choose from, making this toolkit suitable for every trading style whether it's scalping, day trading, swinging, or position trading.
I. Non-Repainting
When an indicator is Repainting , it changes its values as new data arrives, making it an unreliable indicator especially for Buy and Sell signals but this does not necessarily mean that the indicator is less accurate. vStrat Algo 2.0 does not repaint so the signals that were triggered in real time will stay the same during backtesting. If Non-Repainting is disabled, the signal that was triggered on a candle might disappear as new data arrives and once that candle closes, the signal might not even be there anymore, but it could get triggered on the next candle instead.
II. Signal Sensitivity
The Buy and Sell signals are highly accurate but the placement of each signal will differ for each selected preset. The higher the sensitivity (3.0 - 5.0), the more signals will be displayed on the chart. This setting works well when scalping using lower timeframes (1 min - 5 min). As the sensitivity lowers (0.5 - 2.5), less signals are displayed on the chart. If you are day trading or swinging, the lower presets are recommended as they are smoothed and will have less noise. Lower sensitivity works well on any timeframe.
III. Safe Mode
This feature hides any Buy and Sell signals that are triggered within the Consolidation Zones. The signals can still vary depending on the sensitivity, CZ Smoothing and CZ Length. The default setting is "3" and "7". "Unfiltered" must be unchecked for the signals to disappear.
IV. Unfiltered Signals
All Buy and Sell signals are displayed on the chart. This feature must be disabled if "Safe Mode" is enabled.
V. Trend Candle Colouring
This changes the bar colors depending on its trend. Green if it's trending up and red if it's trending down.
VI. Trend Cloud
Trend Cloud indicates the current market trend. This can also be used as a confluence to the Buy and Sell signals. Wider cloud indicates a strong momentum on either direction. As the cloud narrows, it could mean a possible reversal.
VII. Pivot Points
Pivot Points are useful for identifying significant support and resistance levels as well as identifying entry, exit, stop loss, and target profit levels.
VIII. Consolidation Zones
Consolidation Zones can be used to identify if the market is ranging. If enabled, it changes the colors of the bars that have low momentum to yellow. It is best to wait for a breakout to enter a trade but you can still be profitable when the market is ranging by trading based off Support and Resistance Levels and Imbalance Zones. Default setting is: Smoothing "3" and Length "7".
IX. Take Profit Levels
Take Profit signals are displayed on the chart as yellow "x". Once the algo detects a potential reversal, a Take Profit signal will be triggered so the user can lock in their profits. The signals can appear more than once so you have the option to keep holding as long as you know the risks. The lower the Length is, the more signals appear.
X. Alerts
Buy and Sell signal alerts can be created by clicking the three dots in the vStrat Algo 2.0 indicator tile.
Disclaimer:
All information found here, including any ideas, opinions, views, predictions, forecasts, commentaries, suggestions, or stock picks, expressed, or implied herein, are for informational, entertainment or educational purposes only and should not be construed as personal investment advice. While the information provided is believed to be accurate, it may include errors or inaccuracies. Conduct your own due diligence or consult a licensed financial advisor or broker before making any and all investment decisions. Any investments, trades, speculations, or decisions made on the basis of any information found on this site, expressed, or implied herein, are committed at your own risk, financial or otherwise.
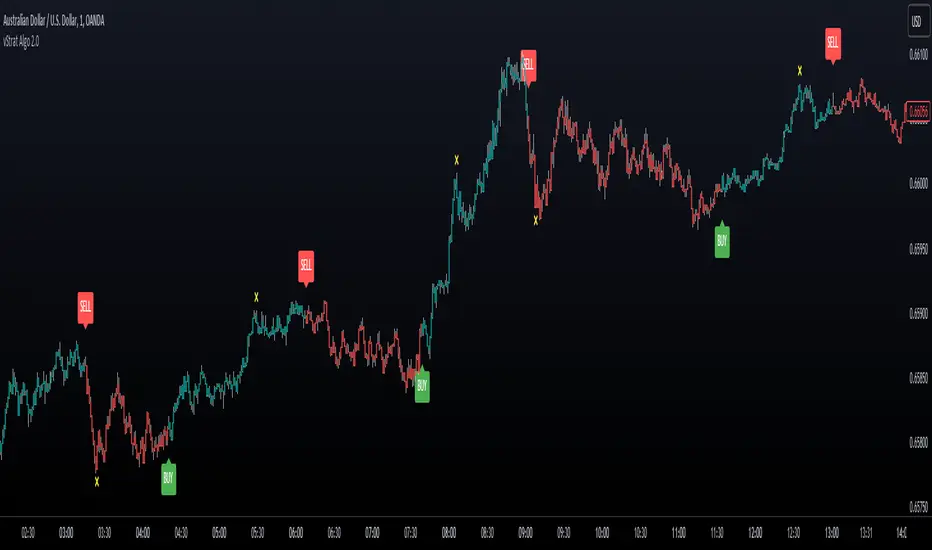
Distance From EMA (%) with TP TableThe indicator will help you to identify where an asset might change direction or where to take profit.
For scalping or day trading is very useful to know where to take profits.
When the price is too far from an EMA a reversal is very likely to occur.
You can set up your own EMA and the percentage where you want to take profits
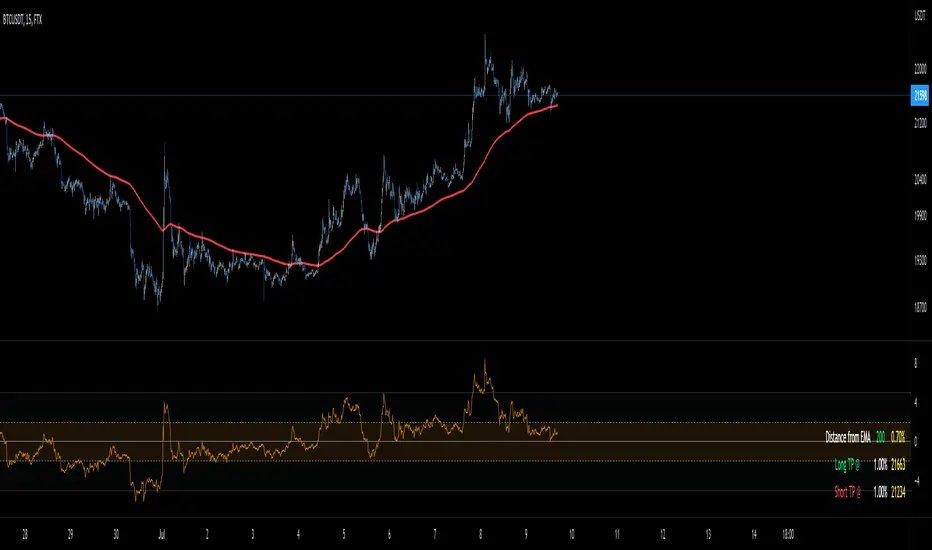
Camarilla Pivots - Signals, Alerts, TP and SL by Tech Store OnThis is a Camarilla Pivots indicator script, which will show signals, take profit and stop-loss on the chart with alerts based on Camarilla Pivot strategies:
LONG signals: S5 > S4, TP1: S4, TP2: S3, TP3: R3 SL: Manual | S3 > R3, TP1: R3, TP2: R4, TP3: R5, SL: S4 | R4 > R5, TP1: R5, SL: R3
SHORT signals R5 > R4, TP1: R4, TP2: R3, TP3: S3, SL: Manual | R3 > S3, TP1: S3, TP2: S4, TP3: S5, S4 > S5, TP1: S5, SL: S3
Mainly, the script is based on the pivot levels and price action. The script will trigger a signal if a supporting direction candle breaks or bounces at certain pivot, triggering a direction of the potential trade with the next pivot serving as a Price Target area, each signal will potentially wait for 3 Price Target areas and if they happen will show each on chart. An opposite direction pivots are used as a Stop Loss, which the indicator will show on the chart. If stop-loss will be hit, the script will not show take profit areas considering the trade is closed with a loss. Same way if take profit area 1 is reach, it is considered that SL is moved to Entry and therefore the script will no longer show stop-loss for that trade. This indicator was mainly tested via 15min timeframe, but feel free to try different timeframes as the concept is the same.
This strategy was extensively manually tested, trade by trade, with S&P 500 ETF 15min timeframe, for back-testing results for the whole 2021 year (this is simply if you would LONG/SHORT stocks, don’t forget that if you trade Options, there is also Theta present (options price decay over time), the win rate is: 86.12%
*** If a trade was uncertain > it was marked immediately as stop-loss
*** A position was always closed at the end of the day no matter what (profit/loss)
Config: Alerts need to be set for each signal, take profit and stop-loss, it is pretty much self-explanatory, just right click the chart, select “Add alert” > next to Conditions select “Camarilla Pivot…”, for each trade signal and stop-loss, make sure it is “Once per Bar Close” and for each take-profit make sure it is “Once Per Bar”. Stop-losses are confirmed price breaks, while take-profits – we just need to touch those pivots.
Config: By Default, indicator signals are given during regular BEST (after 3PM ET – it’s power hour, which often is unpredictable + market will be closing soon) US standard market hours: 9:30AM-3PM ET, take profit and stop-losses by default are set to 9:30AM-4PM ET (US standard market hours. Both can be adjusted via Inputs. If you wish for the signals/take profit and stop-losses to be tracked 24/7 > choose the “EMPTY” space for both.
Config: Number of candles/bars to track back for opened positions is the number of Candles/Bars tracked back for each position. You can change this setting as it relates to timeframe versus trading style (day trading/swing), play around to find your best settings, by default it’s 13, which is best for day trading/15M timeframe. Please note: if position takes “too long” to reach TP or SL, it may not show TP or SL, so you need to keep an eye on this. It is best to use slightly lower number for day trading, because otherwise if you receive the same signal more than twice during the day > it will not show TP or SL for the second/third/etc. position. This is custom for you to change though, so if you want longer position tracking for the day, choose: 26 candles (this is the amount of 15M candles during the day), but keep in mind that for second/third position > it may not show you the TP1/SL.
Config: The table showing positions will show current open position on the bottom cell if position is opened per indicator, you can move or even hide this table in the indicator settings. (Please note: this is decorative thing and sometimes may show a position open, which is not actually open, especially when the market is not currently open).
Tip: Note: if pivots are too far away from each other and there is either big profit already or another support/resistance indicator (VWAP, SMA, support & resistance levels, etc.) – it is wise to take some profit off and move SL to Entry to secure profits in case market decides to turn around. This is especially wise if you trade Options as they include Theta (options price decay over time). Please note: back-test results displayed above were done without VWAP.
Tip: R5 > R4 and S5 > S4 are riskier signals as there are no pivots above/below for the SL, the script does not have a built-in stop-loss level/indicator for these, so you will need to manually set your stop-losses for these signals. Last day pivots often can help with this or simply use most recent support & resistance levels.
Tip: If trading S&P: be careful opening positions near 3PM ET, as during the “power hour” – 3-4PM ET > volatility increases and direction of the price becomes much more unpredictable. Similar: if you are in profit, it is wise to close the majority of your position at 3PM ET, before the “power hour” starts.
Tip: Very conservative trading approach: after signal happens, wait for a bounce back (price going back touching the pivot) and open position right there, that way > SL will be smaller and better risk/reward ration.
Tip: There is no limit on how many signals the script will show if it meets the conditions (in case you miss one of the signals and conditions repeat > you can still get into decent trade at next signal if it matches the condition).
Note1: if candle closes crossing/breaking several pivots at the same time and that same candle will touch take profit pivot – the script is configured to minimize showing/alerting signals/TP/SL for such conditions, so that you don’t get a very dirty chart / spammed with alerts, however sometimes it may or may not show signals and/or take profits/losses incorrectly. Overall, when you see such huge candles, it means that market volatility is bigger than usual, so a caution should be practiced.
Note2: If the signal candle almost nearly touches the first take profit area > it’s best not to open a position (you literally opening it at the first take profit pivot, and it may bounce the other way from that same pivot).
Note3: You may sometimes see take profit/stop-loss indicators in the beginning of the day or simply when pivot levels change, this is due to script registering the position open per old pivot levels and then show you take profit/stop-loss per new pivot levels.

Wizard AlgoWizard Algo:
==============================
Features of the indicator:
- BULL/BEAR Signals
- TP (Take-Profit) and Exit System
- Possible Reversal Signals
- Reversal Scalper
- Reversal Bands
- Trend Bar Colors
- Auto Support/Resistance Levels
- Auto Trend-Lines
================================
Description:
1. Signals: The signals consists of 2 different approaches and the users can choose which signal type they want to use. The indicator gives bull/bear signals based on certain condition, such as trend and momentum. The "TP" signals stands for "Take Profit." These signals help users to decide when to take profits or liquidate all position. The Indicator includes an exit system that can used as another means of closing a position. The exit system uses a 1.5x risk to reward ratio to determine where to keep the take profit and stop loss target.
2.Reversal Scalper: Reversal scalpers are the tiny up(aqua) and down(fuchsia) triangles on the chart. These signals a possible reversal in the price and they can be used to enter a scalping trade. The signals uses mainly momentum and candle price action to determine when there could be a possible reversal in price.
3. Reversal Bands: The reversal band is the green/red cloud like indicator. This can help determine when a price is oversold and therefore, it could reverse. Same goes for the short side, if price is in the overbought territory, then it could reverse to the downside. The reversal bands uses mainly volatility. This is not the same thing as Bollinger bands.
4. Bar Colors: The candle bar colors helps to determine the current trend. The colors are given based on the current trend. The colors lime/red shows strong trend, and orange/cyan/blue shows weak trend.
5. Auto S/R and Auto trendlines: These indicators can be used for determining price actions. Both of these work in similar manner. They mainly look at the previous pivots and draws a line connecting the pivots. S/R are the horizontal lines and the trendline have angles to them.
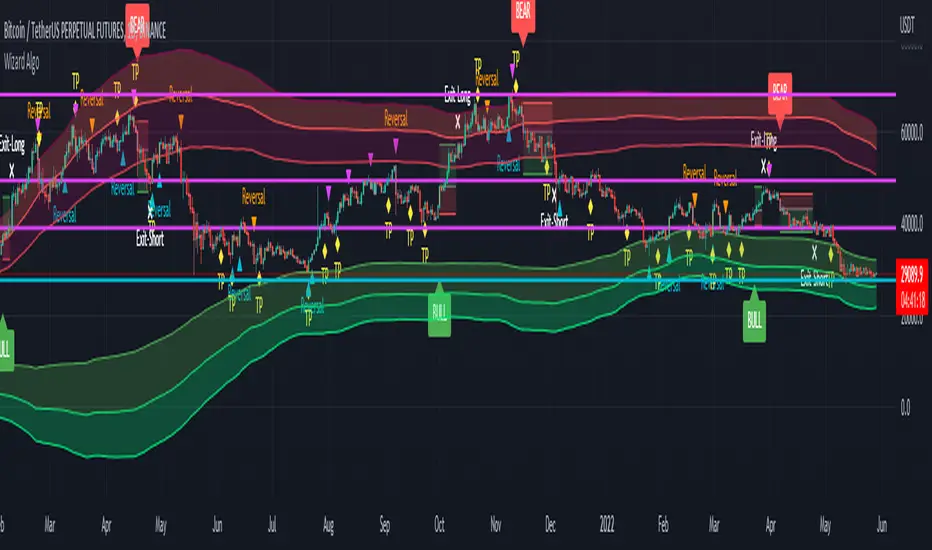
Bounce Manager TrendlinesThe trendline script is made for manual input of trendlines using point clicks on the chart. The script will then see if price respects these lines by the parameters you input in settings panel. On a respectable bounce it will print buy/sell arrows. The script also has functionality to send alerts, this is helpful if you want to automate trendlines . I created this script and many others under the bounce manager toolkit to expand on the signalling capabilities of popular drawing tools as I find using just a crossover to be lacking especialy for full automation.
components:
- Line respect: When price moves past this the script will no longer look for entry until a new trend has been established. The line can also be used as a stop loss.
- Confirmation: When price touches the line during a trend it
will wait to cross over this line to confirm a reaction from the line.
- Consolidation filter: A trend filtering system, this is a distance from
the line price has to break to confirm trend direction.
- Stop loss: This can be set to a percentage distance from the low after
bounce. Or it can be set to the line respect line
- Take profit: This can be a fixed take profit target or a risk to reward
based take profit. With risk to reward it will multiply the stop loss
distance by the input and use that to create target (green cross)
- ATR based or % based: there are 2 versions of the script, one for strict
percentage based logic and another one based on ATR values
If you are having problems figuring out which settings to use I recommend you check the Bounce Manager ATR script for reference as this script plots the components:
Zignaly automation settings:
zignaly integration, you can use the settings panel to decide your risk management. Option to use a fixed take profit % or an automatic risk to reward calculation based on the stop loss. Stop loss can get calculated using the max violation setting as a stop loss (this will put stop loss below line respect level) or when not checked it will use 0.01% below the low of the signal candle as stop loss. Just add your zignaly private key in the settings and use any alert function call as alert. Make sure to use zignaly.com as your webhook url.
If 5 trendlines are not enough use the 20 line input version, this script is for the clean strong trendline trader.
Part of the Honest Algo indicator suite

Bounce Manager 20 TrendlinesThe trendline script is made for manual input of trendlines using point clicks on the chart. The script will then see if price respects these lines by the parameters you input in settings panel. On a respectable bounce it will print buy/sell arrows. The script also has functionality to send alerts, this is helpful if you want to automate trendlines. I created this script and many others under the bounce manager toolkit to expand on the signalling capabilities of popular drawing tools as I find using just a crossover to be lacking especialy for full automation.
components:
- Line respect: When price moves past this the script will no longer look for entry until a new trend has been established. The line can also be used as a stop loss.
- Confirmation: When price touches the line during a trend it
will wait to cross over this line to confirm a reaction from the line.
- Consolidation filter: A trend filtering system, this is a distance from
the line price has to break to confirm trend direction.
- Stop loss: This can be set to a percentage distance from the low after
bounce. Or it can be set to the line respect line
- Take profit: This can be a fixed take profit target or a risk to reward
based take profit. With risk to reward it will multiply the stop loss
distance by the input and use that to create target (green cross)
- ATR based or % based: there are 2 versions of the script, one for strict
percentage based logic and another one based on ATR values
If you are having problems figuring out which settings to use I recommend you check the Bounce Manager ATR script for reference as this script plots the components:
Zignaly automation settings:
zignaly integration, you can use the settings panel to decide your risk management. Option to use a fixed take profit % or an automatic risk to reward calculation based on the stop loss. Stop loss can get calculated using the max violation setting as a stop loss (this will put stop loss below line respect level) or when not checked it will use 0.01% below the low of the signal candle as stop loss. Just add your zignaly private key in the settings and use any alert function call as alert. Make sure to use zignaly.com as your webhook url.
The trendlines you see in preview are based on a long term pitchfork on BTCUSDT 10H chart
If 20 trendlines are too much I will be releasing a 5 line input version, this script is more to be used to automate pitchforks, gann boxes etc.
Part of the Honest Algo indicator suite

Bounce Manager S/RThis script is based on the bounce manager ATR script
The S/R script is made for manual input of horizontal S/R lines, the script will then see if price respects these levels by the parameters you input in settings panel. On a respectable bounce it will print buy/sell arrows. The script also has functionality to send alerts, this is helpful if you want to automate S/R lines.
An easy strategy to use would be the one you see in the preview using a grid of round numbers. This script in no way shape or form promises easy gains and like all algorithms should be forward tested on a paper trading account before using real money.
components:
- Max violation: When price moves past this the script will no longer look for entry until a new trend has been established. The line can also be used as a stop loss.
- Confirmation line: When price touches the line during a trend it
will wait to cross over this line to confirm a reaction from the line.
- Min past distance: A trend filtering system, this is a distance from
the line price has to break to confirm trend direction.
- Stop loss: This can be set to a percentage distance from the low after
bounce. Or it can be set to the max violation line
- Take profit: This can be a fixed take profit target or a risk to reward
based take profit. With risk to reward it will multiply the stop loss
distance by the input and use that to create target (green cross)
- ATR based or % based: there are 2 versions of the script, one for strict
percentage based logic and another one based on ATR values
Part of the Honest Algo service.
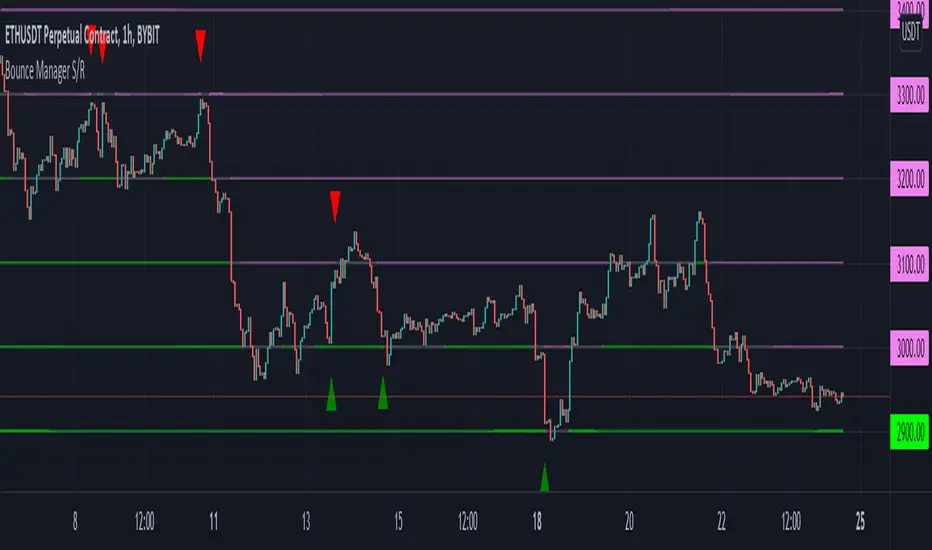
Bounce Manager ATRThis is a tool to turn any line or indicator into a signaller from bounces from the source line.
The ATR version is build to specify what would be considered a worthy entry from the line using ATR multiplier values as inputs.
COMPONENTS:
- Max violation: When price moves past this the script will no longer look for entry until a new trend has been established. The line can also be used as a stop loss.
- Confirmation line: When price touches the line during a trend it
will wait to cross over this line to confirm a reaction from the line.
- Min past distance: A trend filtering system, this is a distance from
the line price has to break to confirm trend direction.
- Stop loss: This can be set to a percentage distance from the low after
bounce. Or it can be set to the max violation line
- Take profit: This can be a fixed take profit target or a risk to reward
based take profit. With risk to reward it will multiply the stop loss
distance by the input and use that to create target (green cross)
- ATR based or % based: there are 2 versions of the script, one for strict
percentage based logic and another one based on ATR values
In bounce manager v1 these stop loss and take profit targets are there only for plotting and visual backtesting purposes. Right now it can only send long and short signals.
Part of the Honest Algo service.
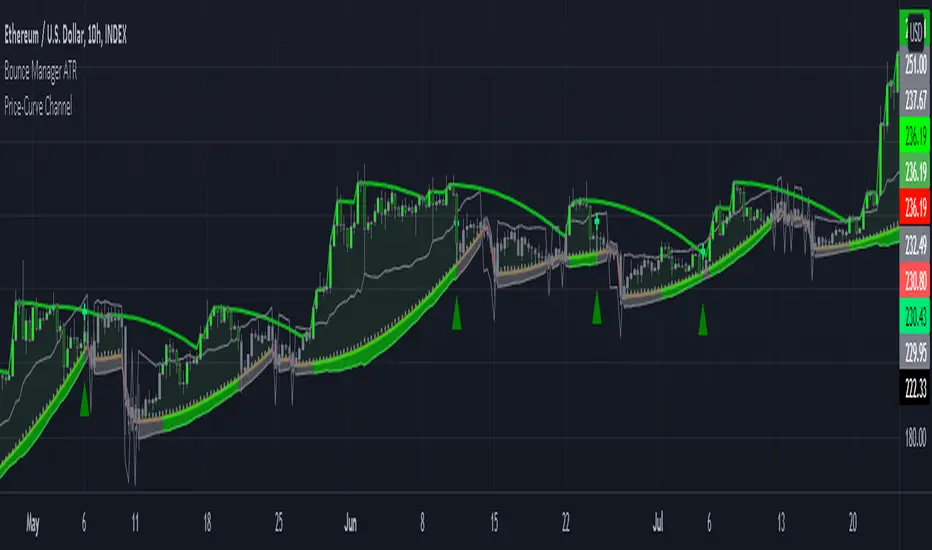
PVSRA Volume Price - Some people say "Price Action is King". I say, we cannot know how the MMs (Market Makers) will move price next, period. But price tends to consolidate above key SR when MMs are filling short orders for SM (Smart Money) and long orders for DM (Dumb Money), and price tends to consolidate below key SR when MMs are filling long orders for SM and short orders for DM. The MMs are also "SM", and they tend to do the other SMs "one better"! This means that after the MMs fill the SM/DM orders, they might move price a bit further in an attempt to stop out some of those SM executed orders and sucker in more DM; both giving liquidity for the MMs to add to their own SM side position. Yes, the MMs are bastards. But the point is that could leave price not "nicely" above or below a SR anymore, yet more consolidation can occur.
Volume - Increases in activity denote increase in interest. But, is it long or short interest? Where is price in the bigger picture when this is happening? Is it at relative highs, or lows in the overall price action? And if a high volume bar is for a candle which you can examine by going to lower TF charts, you might see where in the spread of that candle the most volume occurred, high or low! Using volume is about taking note of relative increases in volume and what price is doing at the same time. Are the better volumes favoring the lower or the higher prices, as the MMs waffle price up and down? And do the volumes get particularly notable when the MMs take price above or below key SR?
S&R - Read all about S&R at "Baby Pips.com". What I want you to realize here is that the whole, half and quarter numbered price levels (hereinafter referred to as "Levels") are the most important SR of all in this market! Not because price stops, pauses, proceeds or reverses there, but because it is above or below these levels that important consolidation (MMs filling SM orders) takes place. Once SM long orders are filled, they become interested in placing orders to close them at higher prices, and hence the MMs will be moving price higher, eventually. Once SM short orders are filled, they become interested in placing orders to close them at lower prices, and hence the MMs will be moving price lower, eventually.
PVSRA - If we can spot consolidations above/below key SR, examine the overall price action on various TF charts, and take note of where the notable increases in volume have most recently occurred (did volume favor relative highs or lows), then we can build a consensus about what kind of orders the MMs have most recently been filling; buying to open longs or close shorts, or selling to open shorts or close longs. And we can get a better idea if things will next become bullish or bearish. And once PA confirms our bullish or bearish PVSRA results, by recognizing the importance of Levels we can look beyond current PA in the direction it is going and look to historic PA S&R (consolidation around key Levels) to come up with candidates for where the price might be headed. And bull or bear swings typically run in terms of 100+, 150+, 200+ pips, .....etc. And now you know why.
Okay. Now, if this is your first introduction to PVSRA, and having just read the above, you are likely scratching your head and still confused. That is normal. I will tell you a secret about the market and why you have a right to be confused. The secret is this. The market cannot be defined by mathematics nor by immutable logic. This is why the most advanced mathematicians over a century have never even come close to cracking the market. It cannot be done. Something else, other than math and immutable logic is the fundamental operand in the market. Have you ever watched a child attempt a jigsaw puzzle for the first time? And watched as that child grew and attempted more of them, and more complex ones? What is at work in the market I will elaborate on later, but for now trust me in this. We need to apply ourselves to learning how to do PVSRA just as a child attacks learning how to do jigsaw puzzles. And we must continue doing PVSRA, because in time our mind will "learn" when we have just picked up an important piece of the puzzle, and that we know where it goes! Developing the skill of PVSRA is an art form. We must not allow ourselves to feel badly if we miss clues. PVSRA is an art form that takes time to perfect. Over time our skill will grow and our "read" of the unpredictable market will improve. We must take to ongoing learning and application of PVSRA.
Introduction to How the Market Really Works
Does anybody remember the "lil' Abner" cartoons in the Sunday papers? Let me draw for you a mental picture of how the market really works.....
Imagine Daddy Yokum ferociously racing a buckboard wagon up and down the steep inclines and declines in the rough, rocky mountain road that has sharp turns and a sheer cliff on one side. The wagon wheels are spewing rocks off the side of the cliff! Even Daddy Yokum's shotgun is going off due to the jolting of the buckboard! Daddy Yokum has a demented look on his face, but he is smiling! The horse has a wild look in it's eyes and is frothing at the mouth. There are two passengers being tossed around in the back of the buckboard, terror stricken! Now, let's pan back from this cartoon picture and place the labels needed. On the side of the wagon is the sign "Market Pricing". The demented, smiling Daddy Yokum, is the Market Maker. The passengers being tossed around are the buyers and sellers.
.....Got it? Market prices are not determined by the buyers and sellers. They are determined by the Robber Bank Market Makers (MMs).
MMs are Market Manipulators of Price, and Thieves!
The "market" is the sole creation of the Robber Banks that "make the market". While it serves the world of commerce, they run it to make profits. And they opened the market up to foster prolific currency trading by others for the sole purpose of making more profits. They move prices up and down to "create liquidity" to fill the orders of SM (Smart Money) and DM (Dumb Money), for the commissions they make by filling the orders. When they have some orders above the current price and some below the current price, who do you think determines the sequence of direction and distance the price is going to move so these orders can be filled? And always - since they know how they are going to move price next - they take positions themselves to make additional profits.
They do this by:
1. Manipulating price to sucker into the market DM that is taking the wrong side position.
2. Manipulating price to sucker into the market SM that is taking the right side position, but too soon, and later manipulating price to hit their stops.
They have total control of pricing, and by these actions they effectively "steal" from others the money to fill their own "right side" positions before moving the price to the next area they have decided on for filling orders, and for taking profit on their positions built beforehand. Don't get me wrong. I do not object to the market volatility these thieving Robber Banks create. We need it. But we also need to understand what these people are like, the cloth they are cut from. They are crooks, and we have to be extra careful about trading in the market they operate. On some special days you can see them in their true colors. We should witness it. Take note of it. Speak of it. And remember it!

[astropark] Trend Skywalker V2 [alarms]Dear Followers,
today I'm glad to present you Trend Skywalker V2 , the evolution of Trend Skywalker V1 indicator that you can see here below:
This indicator works on every timeframe and market, it's quite responsive to market movements, so it's especially good on volatile markets.
In this new version you have 3 trend clouds available :
a short-term one (yellow)
a mid-term one (green)
a long-term one (blue)
You can also enable an option to show all trend clouds as one, the result will be similar to a special bollinger bands tool.
Of course you can edit trend clouds analysis period and color, also you can turn on or off the cloud that you prefer.
The indicator can run 4 different kinds of strategy : one for each trend cloud individually or a mixed one.
Also the indicator tracks for you a peak profit from entry: this tracker is a suggestion for you to take profits while price goes up!
All red-green circles you see in the chart is a reminder that a peak profit label was there in the past: what does this tell you?
if price starts losing the short-term trend and you had a lot of TP suggestions, maybe trend ended and you should start consider closing your trade before you give back all your profit.
This indicator will let you set alerts on each buy/sell/close/tp label.
For backtesting, you can use the indicator here below:
This is a premium indicator , so send me a private message in order to get access to this script.

HPH's FractalTradesThis indicator is based on some dark fractal magic.
Not really, it's inspired by Vladimir Poltoratskiy and basically just waits for the price to go higher or lower than a previous fractal. If that's the case and all the additional settings allow the trade to take place, it is entered with the stop loss at the last opposite fractal of were it was entered (so if we enter a trade because the price went higher than the last up fractal, the sl is at the last down fractal).
The trades are visualised with a stop loss and 3 take profits levels (at a 1:1, 2,1:1 and 4:1 risk/reward ratio). The stop loss will trail once a certain take profit level is reached. Enjoy!
The settings:
LiveVersion : If ticked it will use close for stop losses and take profits. If unticked high and low will be used. Neither is accurate when backtesting as there is no intrabar data...
CancelEarly : Swings trade in the opposite direction when an opposite signal is received. If unticked the trade will continue until a tp or sl is hit.
ShowStats : Show a table in the top right displaying how many times the stop losses or take profits got hit.
FractalPeriods : Number of bars that are required for a fractal. E.g. if it's 2, 2 bars need to be lower on the left and right of a candle for it to print an up fractal.
MinFractalDiv : If this is bigger than 0, it will not allow new fractals to print unless they are at least a percentage based amount bigger than the last one. So this can be used to filter out fractals that are in the same range. Bigger value = more aggressive filtering!
TicksOnFractal : Tick based offset to add onto the fractals to enter trades. E.g. if it's 5 and the price goes above an up fractal, it needs to go up 5 more ticks to enter a trade.
UseFilter, FilterMultMin and FilterMultMax : If ticked, trades are limited to the once in the specified range (distance of the stop loss). E.g. if FilterMultMax is 0.05, the stop loss can not be bigger than 5% of the assets price for the trade to take place.

Risk Management Tool [LuxAlgo]Good money management is one of the fundamental pillars of successful trading. With this indicator, we propose a simple way to manage trading positions. This tool shows Profit & Loss (P&L), suggests position size given a certain risk, sets stop losses and take profit levels using fixed price value/percentage/ATR/Range, and can also determine entries from crosses with technical indicators which is particularly handy if you don't want to set an entry manually.
1. Settings
Position Type: Determines if the position should be a "Long" or "Short".
Account Size: Determines the total capital of the trading account.
Risk: The maximum risk amount for a trade. Can be set as a percentage of the account size or as a fixed amount.
Entry Price: Determines the entry price of the position.
Entry From Cross: When enabled, allows to set the entry price where a cross with an external source was produced.
1.1 Stop Loss/Take Profit
Take Profit: Determines the take profit level, which can be determined by a value or percentage.
Stop Loss: Determines the stop loss level, which can be determined by a value or percentage.
2. Usage
One of the main usages of position management tools is to determine the position size to allocate given a specific risk amount and stop-loss. 2% of your capital is often recommended as a risk amount.
Our tool allows setting stop losses and take profits with different methods.
The ATR method sets the stop loss/take profit one ATR away from the entry price, with the ATR period being determined in the drop-down menu next to the selected methods. The range method works similarly but instead of using the ATR, we use a rolling range with a period determined in the drop-down menu next to the selected methods as well.
Unlike the available position management tool on TradingView, the entry can be determined from a cross between the price an an external source. The image above shows entries from the Volatility Stop indicator. This is particularly useful if you set positions based on trailing stops.

Poor ReversalsPoor Reversals Indicator
This indicator finds Poor Reversals. Poor reversals are reversals in price with consecutive highs or lows that are close together. Look for the different types of highs and lows. Some say candle patterns don't matter, but they forget it's the orderflow that makes the pattern. Find poor, tweezer, and 1 tic rejections and study what happens next. We don't need to read the depth of market to see what the orderflow is saying. They are called poor because the auction didn't run its course. It didn't continue the direction until all activity in that direction was exhausted. Proper reversals create excess. Excess is a long tail/wick. A proper reversal leaves a long tailed excess unfilled.
The different highs and lows give clues to what kind of orderflow happened there. The difference between them is which high or low happened first. Price does often come back to these areas and clears them up with a proper reversal. We can see them on all timeframes. Knowing what they mean in the orderflow helps with reading charts.
The Poor Reversals are:
Poor
1 Tick Rejection
Tweezer
When looking at 2 bars that have very close high or lows, there are a few different types. They are each poor and can be further defined as each are price action clues.
If next low is higher, it's a poor low
If next low is lower, it's 1 tic rejection
If next low is equal, it's tweezer bottom
If next high is lower, it's a poor low
If next high is higher it's 1 tic rejection
If next high is equal it's tweezer bottom
Poor Highs and Lows:
The high or low comes first. The next bar does not go past it. Poor highs and lows are often created from price exhaustions. This means at poor highs buyers are trapped. At poor lows sellers are trapped. Price ran out of steam to continue in that direction. There wasn't enough activity and participation to continue the auction in that direction.
Poor lows are defined when 2 lows are very close, and the 1st bar is lower. The 2nd comes very close to a new low. It happens most when shorts, at the moment, "run out of steam". They were "too aggressive" and got themselves "short in the hole". When a poor low is made, price will bounce because shorts are buying to protect profits.
Poor highs are defined when 2 highs are very close. The 1st bar is higher. The 2nd comes very close to a new high. It happens most when longs, at the moment, "run out of steam". They were "too aggressive" and got themselves "long in the tooth". When a poor high is made, price will pullback because longs are selling to protect profits.
1 Tick Rejections:
The high or low comes last. The next bar goes just a little bit beyond it. A "1 tic rejection" happens when a new low is made and quickly rejects. The name is misleading. It doesn't have to be "1 tic". Different markets have different measurements. For ES, it's less than 8 tics. For NQ, it's about 5-20 points. It varies depending on relative market volatility.
1 Tick highs are defined when 2 highs are very close, and the 1st bar is lower. This happens when longs are aggressive and drive price up. Price makes a newer high and longs rapidly start taking profits. Their selling activity drives price lower. In the orderflow, longs likely closed at the same time new shorts sell. This competition to sell drives price lower. At the high, it says longs saw it wouldn't go higher and they took rapid exit.
1 Tick lows are defined when 2 lows are very close, and the 1st bar is lower. This happens when shorts are aggressive and drive price down. Price makes a newer low and shorts rapidly start taking profits. Their buying activity drives price higher. In the orderflow, shorts likely closed at the same time new longs buy. This competition to buy drives price higher. At the low, it says shorts saw it wouldn't go lower and they took rapid exit.
Tweezer Tops and Bottoms
The highs or lows of the bars are equal. Tweezers most often mean that an aggressive trader is influencing price. They drove price in one direction and then quickly reversed sentiment. Tweezers most often happens in stop hunts. An aggressive trader found where the stops were located and then entered an aggressive order to turn the market.
Tweezer Tops are defined when 2 highs are equal. The first bar sets the high. The second bar matches the high. This happens when there is an active seller entering. It could be simple profit taking from longs or new aggressive shorts. In bull trends, price will move up to find short stop. When the stops are found, the market reverses sharply lower.
Tweezer Bottoms are defined when 2 lows are equal. The first bar sets the low. The second bar matches the low. This happens when there is an active buyer entering. It could be simple profit taking from shorts or new aggressive longs. In bull trends, price will move up to find long stops. When the stops are found, the market reverses sharply higher.
Poor Reversals can be poor, 1 Tick Rejections, or Tweezers. They are all considered poor and upon further investigation we can see they are created from different conditions in the orderflow. They are not called Poor Reversals because they are weak. They are called poor because of the action that happened there. One side got caught in a bad position. Other sharks in the market smelled blood and ripped them apart.
This indicator is a work in process. While the concepts are great for real time trading, this indicator is not designed to be used in real time trading. It will repaint based on the bar close. The purpose of this indicator is to train our brains to see these nuances on candle charts. Some say candle patterns don't matter, but they forget it's the orderflow that makes the pattern. We must make split second decisions and knowing the context behind the orderflow reduces response time. These poor reversals don't have to retest, and the best ones won't come back. I use these concepts to find exits, where my trades might be wrong, confirmation I'm on the right side. It's amazing how these simple nuances can turn the markets. But sure enough, they do. Check them out in all time frames.
It's a fun indicator to play with. Some markets do require tweaks to the “Ticks” setting. Too big and charts will be noisy. Too low and not much will show up. A general rule of thumb is more volatile markets need higher tick values while less volatile need lower Tick values. Higher timeframes are also more reliable than lower time frames. I've included some customizable settings and I plan on adding more in the future. Enjoy!

CUT MY LOSSESS - Levereged Stop loss + R / R ratio checker Hello traders!
We have heard many times that keep your losses small and allow your profits to grow. But what happens is that we often make the mistake of doing high-margin trades that we cannot afford to lose. The main reason for this problem, in my opinion, is the rush to open a position and not paying attention to how much acceptable loss in each trade is for us? Is our stop loss point compatible with the loss we are willing to accept?
Many of the losses we incur are not due to our erroneous analysis but to the wrong trading strategy, miscalculation of Stop Loss and failure to calculate the Risk/Reward for each trade. At least for most novice traders, these mistakes happen .
This script does not have complicated logic and is designed only as a help for those who are not interested in working with calculators !! I hope that sometimes that we are very excited to buy, looking at this script can give us a serious flip to avoid risk .
This is a basic script that helps us to intuitively check our stop loss in according to our leverage and to guess the approximate risk/reward of our trade. This script assumes that you always trade with half of your total capital. It is also assumed that you routinely use up to ten percent of your capital for each trade. Therefore, the first variable in this script is the amount of tolerable loss in each trade for you, which is set to 25% by default. So if you follow the previous assumptions, each trade will endanger 2.5% of your capital.
Since not all analyzes are ever accurate, we need to enter into positions that have good Risk/Reward ratio, so that even if half of our analysis fails, we will profitable. Therefore, the second variable in this script is the acceptable Risk/Reward ratio for us, which is set to 1:4 by default.
Also, to check the efficiency of the stop-loss with different trading leverage, I add five leverage by default from 1 to 5 as lines on the side of your stop-loss point.
LeV A (Lowest Leverage-WHITE): 1 by default
LeV B (AQUA): 2 by default
LeV C (YELLOW): 3 by default
LeV D (ORANGE): 4 by default
LeV E (Highest Leverage-RED):5 by default
You can change all these leverages and Acceptable margin loss and R/R ratio according to your needs.
You can also hide the leverage lines you are not dealing with through the script settings .
You will also see lines on the side of your target point to check your risk/reward ,so you can approximate your target according to your trading leverage and the risk/reward you accept. you can also hide these R/R lines from the setting.
Important Note: This script is not designed to give you a stop loss point or take profit point.
To find these points, you must use technical analysis methods , and then use this script to check the coordination of these points with your trading strategy.
Using the script is simple, but I will try to explain it with a few examples.

MRC Trend Trader [VK]MRC Trend Trader one of the best indicator by VK. Usable for Trend, Swing, positional Trading. Works on all types of markets and symbols, Best To use in Time Frame Higher Than 30m
About The Indicator :
This indicator uses MACD to scan the Trend Based on Higher TF and RSI+CCI for entries . It also has the ability to plot MACD crossing signal line in higher TF, plotted on the bottom of the chart and ATR is used for Stop Loss, plotted below Signals. One of the best function of this indicator is support/resistance levels, dot lines plotted on the chart, Which can be used to Take Profit as targets.
How To Use :
The main strategy behind this indicator is to only Long When Background Trend is green and only Short when Background trend is red . Enter on B/S Signal close.
Functions :
- MACD to scan Trend and MACD cross on Multi Time Frame.
- RSI to find lower Buy entry and Higher Sell entry (MTF - Only use current TF or Lower).
- CCI to find continuation entries (More Signals).
- Stop Loss.
- Support and Resistance Levels (Take Profit Targets).
This indicator is set up keeping Money management as one of the main priority, Keep taking profits on targets and always move Stop Loss to Breakeven Once in Profit.
PM for access.

OH2B Trading Indicator Ver2.0OH2B TRADING INDICATOR
The OH2B Trading Indicator is an indicator built for beginners.
It gives you entry points for BUY and SELL based on Trend Channel and Ema-Crossover.
It also gives you EXIT POINTS for taking profits based on the Average Directional Index and Relative Strength Index.
TRADING WITH OH2B INDICATOR
The OH2B Trading Indicator gives you entry points for BUY or SELL .
When the ema1 crosses above ema2, the trend channel will be painted GREEN in color, and a BUY signal will appear. = BUY
When the ema1 crosses below ema2, the trend channel will be painted RED in color, and a SELL signal will appear. = SELL
When a BUY or SELL signal appears on the chart, don't rush into any trade.
Please allow a few hours for confirmation of signals .
After confirmation, it is suggested to enter 50% first and another 50% near the Trendlines .
After entering a trade, please remember to set a stop-loss alert of an opposite signal.
To TAKE PROFIT , please follow the Triangles indicated on the chart
RED Triangles are the Take-Profit targets for the BUY (long) signal
GREEN Triangles are the Take-Profit targets for the SELL (short) signal
*After taking profit, please set a Stoploss to at least break-even level to protect your profits.
Often the price goes to the Trendlines after the signal, so keep some funds to increase the position or even open all position near the Trendlines , or use it for re-enter with SL after you closed position on TPs.
Setting alerts for Trade
Remember to set an alert so that you won't miss any opportunity.
TradingView will notify you immediately when a new signal pops up on the chart.
Tips for the beginners:
Recommended using the indicator at 1H - 2H Timeframe .
Recommended using the indicator for Spot Trading at both Crypto and Stock Market.
Do not use leverage above 5x.
No more than 5% of the deposit in one trade.
Do not rush into any trade when a new signal pops up, please allow a few hours for confirmation of signals.

OH2B Trading Indicator for Swing TradingOH2B Trading Indicator
The OH2B Trading Indicator is an indicator built for advanced traders.
It gives you entry points for BUY and SELL based on Trend Channel and Ema-Crossover.
It offers you a higher frequency of signals for swing trading.
The Take-Profit Indicator gives you exit points for taking profits based on the Average Directional Index and Relative Strength Index.
Trading with Both Indicators
Orange Zone : Wait for the next signal from OH2B Trading Indicator.
The OH2B Trading Indicator gives you entry points for BUY or SELL .
When the ema1 crosses above ema2, the trend channel will be painted GREEN in color, and a BUY signal will appear. = BUY
When the ema1 crosses below ema2, the trend channel will be painted RED in color, and a SELL signal will appear. = SELL
When a BUY or SELL signal appears on the chart, don't rush into any trade.
Please allow a few hours for confirmation of signals .
To take profit, please follow the Take-Profit Indicator at the bottom.
RED dots are the Take-Profit targets for the BUY (long) signal
GREEN dots are the Take-Profit targets for the SELL (short) signal
*After taking profit, please set a Stoploss to at least break-even level to protect your profits.
When the price enters the Orange Zone again, you may close your trade and wait for the next signal.
If you like to keep your positions at Orange Zone, please remember to set a stop-loss alert when an opposite signal pops up on the chart.
Often the price goes to the Trendline after the signal, so keep some funds to increase the position or even open all position near the Trendline , or use it for re-enter with SL after you closed position on TPs.
Tips for the traders:
Recommended using the indicators at 1H Timeframe .
Recommended using the indicators for Spot Trading at both Crypto and Stock Market.
Do not use leverage above 5x.
No more than 5% of the deposit in one trade.
Try to enter/exit a position by limit orders.
Do not rush into any trade when a new signal pops up, please allow a few hours for confirmation of signals.